Currently browsing category

MetaStock Blog

How to Use Bollinger Bands® in MetaStock Charts

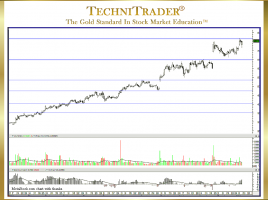
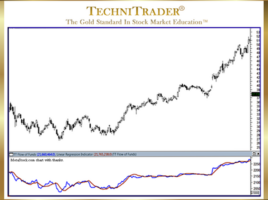
Add Stock Volume Indicators for Direction Stock Will Move The Bollinger Bands indicator has been gaining in popularity. This is no surprise, given the changes in the Market Structure and how price behaves with more of the Exchanges, Dark Pool Alternative Trading Systems (ATSs), Electronic Communication Networks (ECNs), and other …

How to Track Large-Lot Institutions

Learn to Identify Candlestick Patterns in Charts The main challenges Individual Investors and Retail Traders face today are figuring out when High Frequency Traders (HFTs) are going to suddenly appear and when Buy Side Institutions using Dark Pools are quietly buying or selling. There are distinct candlestick and indicator patterns …

Why Learn Dark Pool Candlestick Patterns?

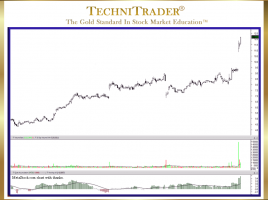
To Enter Stocks Prior to Velocity Runs Dark Pools use precise controlled orders that trigger automatically over extended periods of time. Since the Buy Side Institutions using the Dark Pools are primarily buying for the long term, price can sometimes drop down before moving up. This tendency often leaves Retail …

Why Are Platform Candlestick Compressions Ideal Entries?

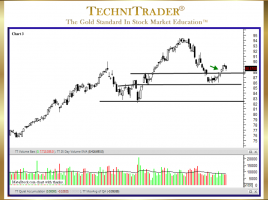
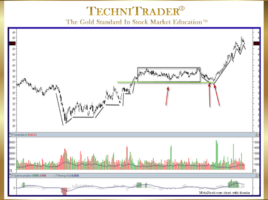
Stock Is Under Dark Pool Quiet Accumulation Platform Candlestick Compressions ideal entries are best for Swing and Momentum Traders, but identifying these compression patterns early is most important. The chart example below is for studying a Relational Technical Analysis™ pattern. This stock was under Dark Pool Quiet Accumulation, which tends …

What Are New Bottoming Formations in the Stock Market?

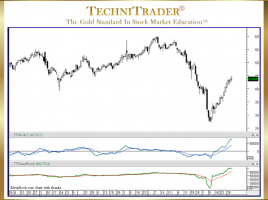
Dark Pool Quiet Accumulation Builds Stock Bottoms During Trading Range Market Conditions when several industries are in their own Bear Market while other industries are continuing a Bull Market, determining when a stock has reached a final low or near the final low is critical for Swing Traders. Typically, they …

Wilder’s Relative Strength Index (RSI) Indicator vs. Stochastic

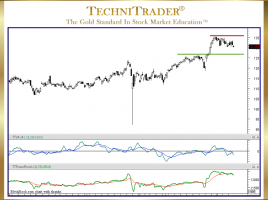
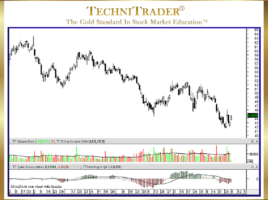
RSI Indicator Exposes Bottoming Stock Formation Strength Prior to Gaps Wilder’s Relative Strength Index (RSI) has added analysis depth when using the center line oscillation feature. Instead of looking at merely Overbought/Oversold patterns of highs and lows, when Wilder’s Relative Strength Index indicator starts to waver around its center line, …

How to Find Stocks to Trade Faster

5 Tips Include Identify Candlestick Price Action Oftentimes, traders just cannot find great stock picks quickly and easily. This leads many traders to resort to relying upon news, recommendations from gurus, social media, or online trading chat rooms. Unfortunately for those traders, High Frequency Traders (HFTs) and other predatory systems …

3 pages