How to Identify Candlestick Patterns of Bounces, Rebounds, & Reversals
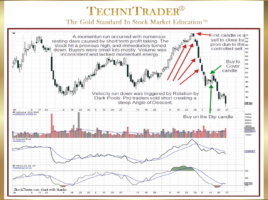
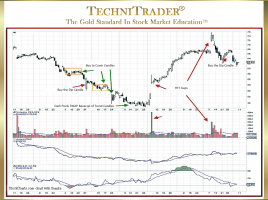
Recognizing 3 Types of Upside Price Action in a Downtrend During a Downtrend, price does not just go down; instead, it often has brief periods where it moves up. Determining whether it is just a Bounce, Rebound, or a true Reversal requires Spatial Pattern Recognition Skills™ to read the stock …