Currently browsing category

StockCharts.com Blog

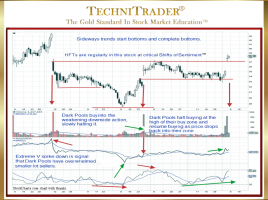
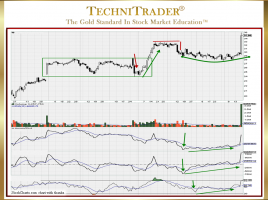
Why Use Stock Volume and Quantity Analysis?

To Identify Price Action by Stock Market Participant Groups Before there were High Frequency Traders (HFTs), Dark Pools, Twilight Pools, and an 80% automated marketplace, the most important indicator was price. Many Retail Traders learned to simply rely upon price action and rarely considered stock volume or quantity analysis. Chart …

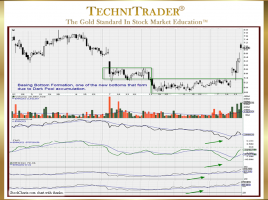
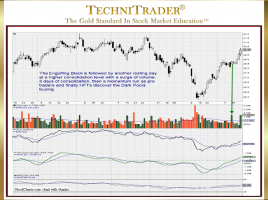
How to Interpret Extreme Candlestick Patterns

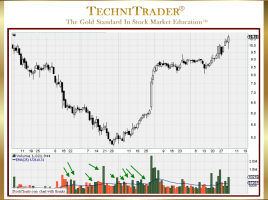
Identify Dark Pool Buy Zones™ in Stock Bottom Formations Every Technical Trader and Retail Trader knows that Bottom Formations are often completed with a Momentum or Velocity Run, but few are able to capture those big gains because they are unable to recognize the candlestick patterns that precede the run. …

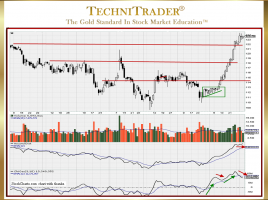
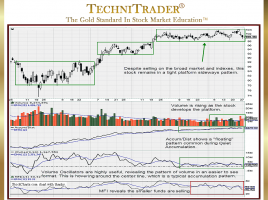
How to Exit Stocks at Correct Technical Level

Identify Resistance Where Professional Traders Would Start Taking Profits Most of the time, Retail Traders are focused on finding stocks to trade. However, they spend scant time on assessing risk, proper stop loss placement, trailing profit stops, and determining when to exit the trade, especially as a stock goes ballistic. …

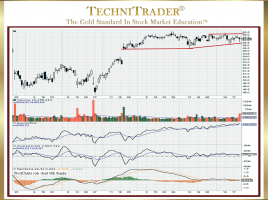
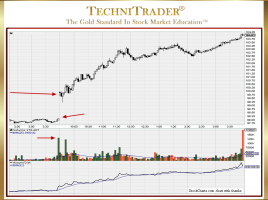
Indicators for Earnings Report Trading Strategies

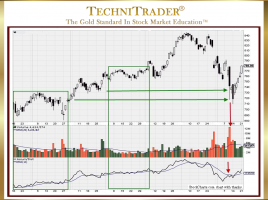
Trade Earnings by Tracking Professional Traders & High Frequency Traders Earnings Season provides plenty of strong momentum runs for Swing and Day Traders. However, many traders struggle with determining how the stock will move on the day of the report release. To succeed at finding Professional Traders’ footprints before an …

6 pages