What Are Causes of High Frequency Trading Front-Running Stocks?
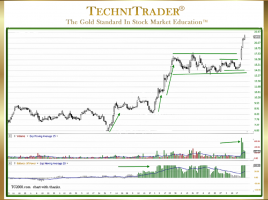
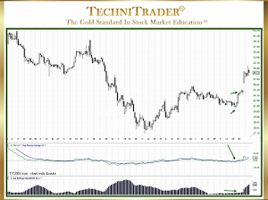
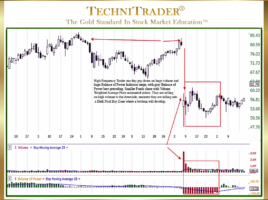
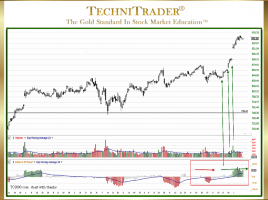
List of 5 Includes Retail Trader Cluster Orders The chart example below shows High Frequency Trading high stock Volume spikes and long candlesticks. They attempted to drive price up as indicated by the green arrow, but the price quickly shifted sideways and then turned down again. The stock did not …