Currently browsing category

TC2000 Blog

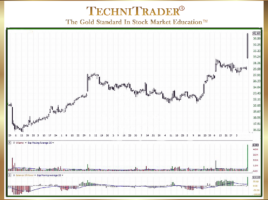
Why Is There Clarity Using Bollinger Bandwidth® Indicator?

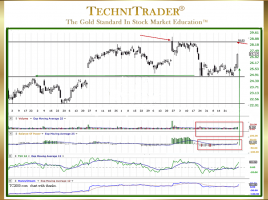
A Technique for Better Bollinger Bands® Analysis Bollinger Bands are by far one of the best indicators for analysis of sideways price action in stocks, finding compression patterns early before High Frequency Trading price surges and providing visual assistance with Spatial Pattern Recognition Skills™ (SPRS) for Beginner Traders. However, using …

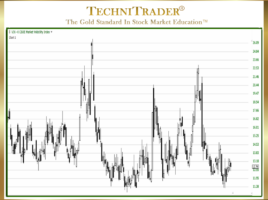
How to Identify High Frequency Trader Activity

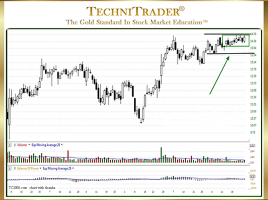
List Provided to Recognize Their Candlestick Patterns High Frequency Trader (HFT) activity occurs often these days, and the HFT candlestick patterns are substantial but unsustainable. Retail Traders who want to learn how to Sell Short during topping markets and downtrends need to be able to identify the “footprints” of the …

What Is the Best Way for Trading Options?

Use Stock Chart Analysis Options Trading requires that you know more than just options chains, puts and calls, and other basics. Options Trading for beginners is often confusing and overwhelming and can result in a significant loss of your capital base unless you learn right from the get-go that trading …

Why Use Balance of Power to Find Dark Pools?

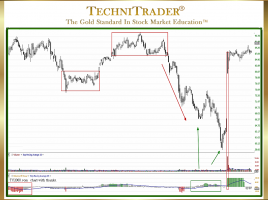
For Identifying Stocks Poised for Momentum Runs Balance of Power (BOP) is an extremely rare and unique indicator. Its origins come from the professional side of the market. It is designed to separate out large-lot activity from small-lot activity. This kind of stock volume aka quantity analysis on the tick-by-tick …

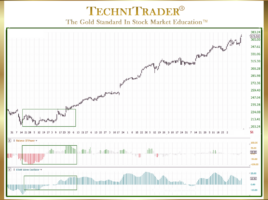
How to Use Balance of Power for Early Entry into Stocks

Shift of Sentiment™ Signals Momentum Energy Is About to Occur TC2000.com Users have a huge advantage over other Retail Traders as they have access to 3 of the most powerful indicators for the markets today which are automated with multi-venues for Stocks and Options. The complexity of the modern markets …

Why Use Stock Volume to Reveal Weak Candlestick Patterns?

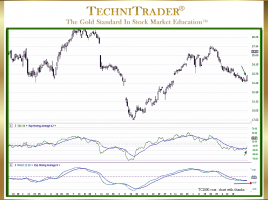
How Retail Traders Avoid Whipsaw Trades Many traders still rely solely upon Price and Price Indicators, which leaves them highly vulnerable to whipsaw trades. Stock Volume reveals weak candlestick patterns, and so it is critical to use it in the automated markets today. This is because the giant Buy Side …

What Is Advanced Technical Analysis of Candlestick Charts?

List of Tips for Choosing High-Quality Stock Picks Advanced Technical Analysis of Candlestick Charts for Trading Stocks gives you more opportunities to trade high-quality stock picks that earn more profits per trade. The goal with every trade you make should be higher profits per trade. Taking pennies for profit on …

How to Use Dark Pools for Higher Profits

Identify Quiet Accumulation Candlestick Pattern Before Stock Runs An area of Technical Analysis that has not made its way into most Stock Market books, articles, and information available on the internet is how to use Dark Pools for higher profits. The reason why Dark Pool technical patterns aka footprints are …

5 pages