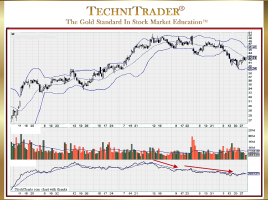
Why Use Compression Candlestick Pattern Indicator Analysis?
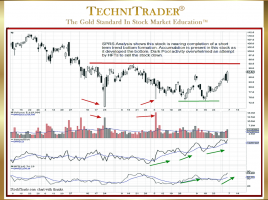
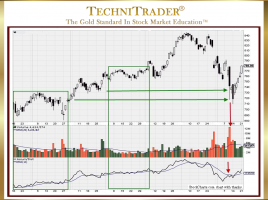
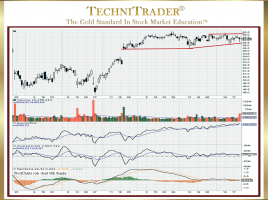
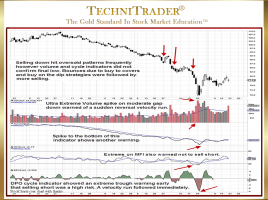
Add Quantity Indicators to Allow for Early Entry into Stocks All indicators have limitations and Market Conditions where the indicator fails, does not provide a true positive or negative pattern, or is simply unable to keep up with the speed of momentum price or stock volume activity. Bollinger Bands® are …

