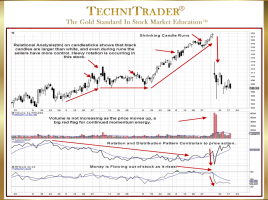
Dynamics of a High Frequency Trading Gap Down
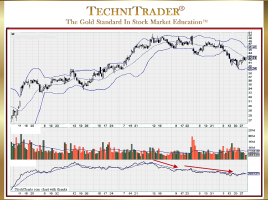
List of Indicator Signals Reveals Dark Pool Quiet Rotation™ The stock chart example in this article has been under Dark Pool Quiet Rotation for over a year as Giant Funds quietly and slowly reduced the number of held shares in their portfolios using Dark Pools in expectation of a slowdown …