Currently browsing tag

price action

Why Analyze Sideways Bottoming Stock Trends?

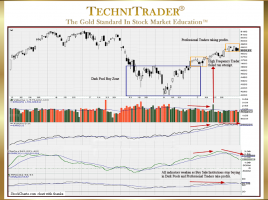
To Identify Dark Pool Buy Zones™ The Shift of Sentiment™ pattern in the stock chart example below clearly and easily shows that Buy Side Institutions using Dark Pools entered this stock and would quickly take control of price. Sideways bottoming stock trend analysis of the chart shows that a sudden …

How to Read a Candlestick Chart for Stock Trading

List of 5 Tips About Price Action Revealed A skill that all traders need to hone and strive to improve constantly is how to read a candlestick chart for stock trading. Candlestick patterns of price action matter. What price is doing tells a great deal about which Stock Market Participant …

What Is the Anatomy of a Swing Trade?

Identifying Large Lots Dominating Buy Side or Sell Side of Momentum Run The most common mistake Retail Traders make in choosing stocks for Swing Trading is to not identify whether the large lots are dominating the buy side or the sell side during the price action momentum run upward. This …

2 pages