
Why Is the Weekly Chart View Invaluable?
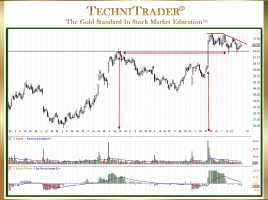
For Interpreting What Price Will Do After Stock Volume Spikes The chart example below with a Daily Chart View shows that High Frequency Traders (HFTs) caused a huge white candlestick and stock Volume spike, as indicated by the vertical red line on the right. Since then, this stock has been …