Wilder’s Relative Strength Index (RSI) Indicator vs. Stochastic
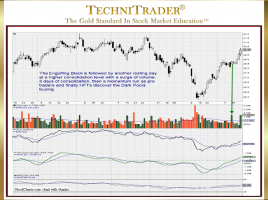
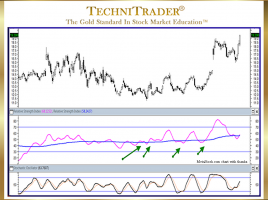
RSI Indicator Exposes Bottoming Stock Formation Strength Prior to Gaps Wilder’s Relative Strength Index (RSI) has added analysis depth when using the center line oscillation feature. Instead of looking at merely Overbought/Oversold patterns of highs and lows, when Wilder’s Relative Strength Index indicator starts to waver around its center line, …