What Are the Best Candlestick Pattern Stock Indicators?
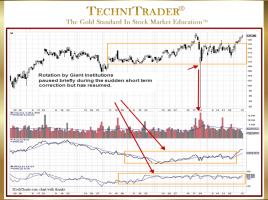
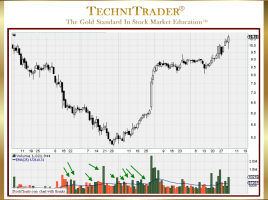
Add Stock Volume & Quantity to Analysis It used to be that price was the most important indicator on a stock chart. Most Stock Indicators, Market Breadth Indicators, and Sector Indicators are based solely on price and time due to the importance weighted on price action in the past. Most …

