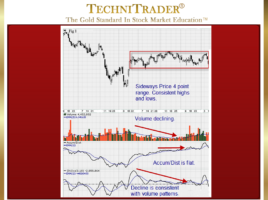
How to Recognize Weakness in a Sideways Candlestick Pattern
Use Stock Volume and Leading Indicators Stocks and the Stock Market move sideways about 70% of the time. Yes, some stocks get into periods of moderately trending activity. However, if you really look at charts just to see the 3 trends of Uptrending, Downtrending, and Sideways, you will see that …