Currently browsing tag

Trading Range Market Conditions

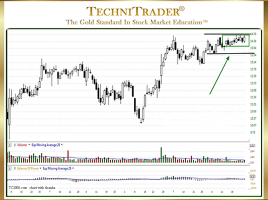
How to Decode a Candlestick Chart with Doji

Use Pure Price as Entry & Exit Signals When Candlestick Charts were first introduced to the western markets, everyone using Stock Charts and Technical Analysis relied on indicators more than Bar Charts, which were the most popular charts back then. Bar Charts are much harder to read, give less visual …

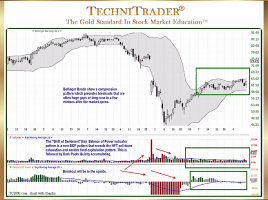
How to Improve Bollinger Bands®

Add Quantity Indicators to Analysis for Stock & Options Trading One of the most exasperating things that happen to Retail Traders and Technical Traders is to find a chart with a perfect setup but the stock has already gapped or ran up with a huge one-day gain, as High Frequency …