Currently browsing tag

TTQA

TechniTrader® Hybrid Indicators for MetaStock Users

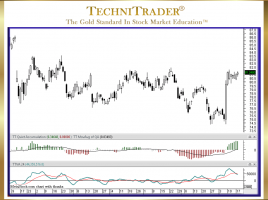
About TechniCators™ and Market Conditions for Trading or Investing TechniTrader Stock Market Education groups indicators together based on obtaining a complete and thorough analysis of all the Market Data available. These are typically 5 Hybrid Indicators we created. Each group is called a “TechniCator”, and there are TechniCators for each …

How to Use Bollinger Bands® in MetaStock Charts

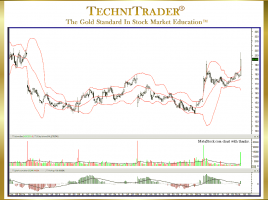
Add Stock Volume Indicators for Direction Stock Will Move The Bollinger Bands indicator has been gaining in popularity. This is no surprise, given the changes in the Market Structure and how price behaves with more of the Exchanges, Dark Pool Alternative Trading Systems (ATSs), Electronic Communication Networks (ECNs), and other …

How to Track Large-Lot Institutions

Learn to Identify Candlestick Patterns in Charts The main challenges Individual Investors and Retail Traders face today are figuring out when High Frequency Traders (HFTs) are going to suddenly appear and when Buy Side Institutions using Dark Pools are quietly buying or selling. There are distinct candlestick and indicator patterns …

What Are New Bottoming Formations in the Stock Market?

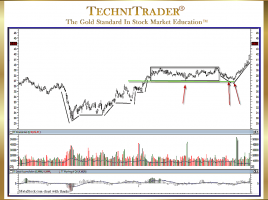
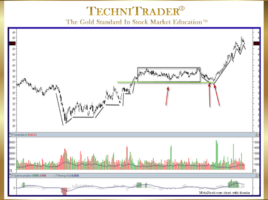
Dark Pool Quiet Accumulation Builds Stock Bottoms During Trading Range Market Conditions when several industries are in their own Bear Market while other industries are continuing a Bull Market, determining when a stock has reached a final low or near the final low is critical for Swing Traders. Typically, they …

How to Read a Candlestick Chart for Stock Trading

List of 5 Tips About Price Action Revealed A skill that all traders need to hone and strive to improve constantly is how to read a candlestick chart for stock trading. Candlestick patterns of price action matter. What price is doing tells a great deal about which Stock Market Participant …

How to Identify Price Action Trading in Topping Stocks

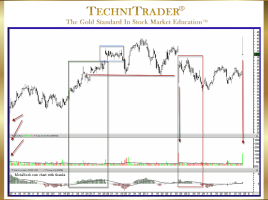
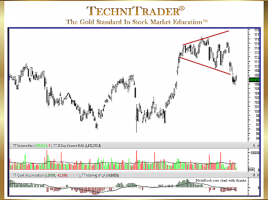
New Candlestick Patterns That Reveal Potential Tops One of the more challenging aspects of being a Technical Trader or Retail Trader in the automated markets today is that the candlestick patterns of Technical Analysis are changing. In particular, How to Identify Price Action Trading in Topping Stocks is often the …

How to Identify High Frequency Traders and Dark Pools

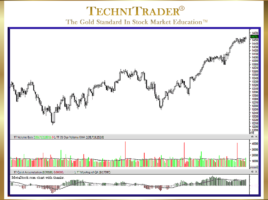
Learn Price and Stock Volume Analysis When the Financial Markets undergo massive internal and structural changes, those changes impact price and stock volume action that Retail Traders depend upon due to their use of charts and technical indicators for stock pick selection and trading. See the candlestick chart example below. …