
How to Identify High Frequency Traders and Dark Pools
Learn Price and Stock Volume Analysis
When the Financial Markets undergo massive internal and structural changes, those changes impact price and stock volume action that Retail Traders depend upon due to their use of charts and technical indicators for stock pick selection and trading.
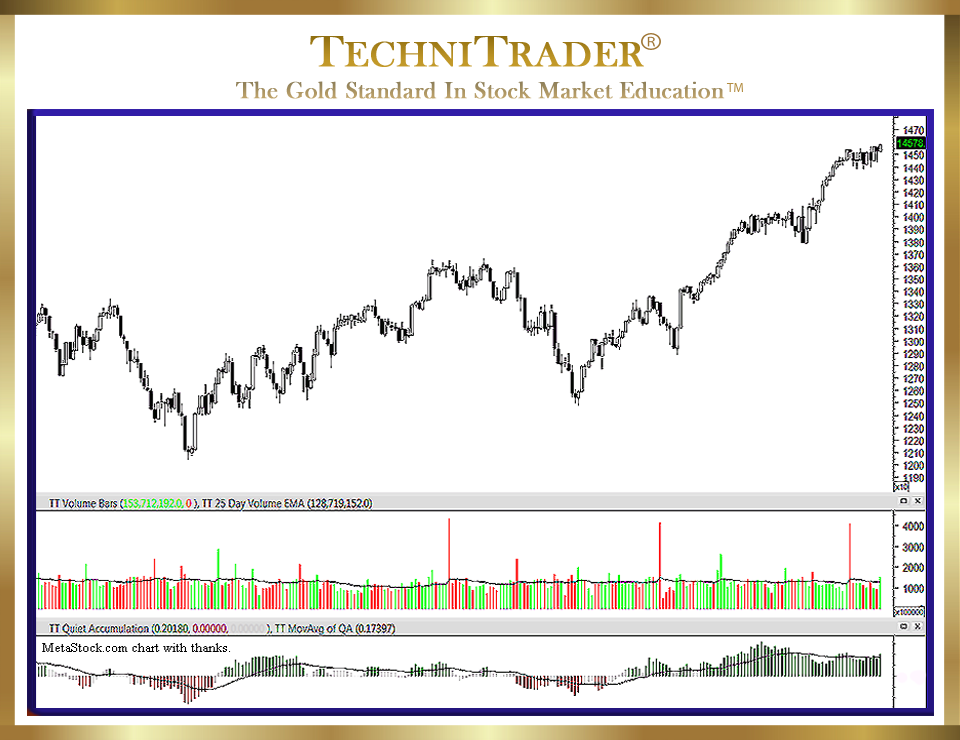
See the candlestick chart example below.
Candlestick charts have become the standard for most Retail Traders, and there are numerous brand-new candlestick formations. Candlesticks were introduced to the western markets in the early 1990s by Steve Nison. The translation from Japanese commodities markets trading candlestick formations was exact and precise, including the unique and artistic visual names assigned by the Japanese to different candlestick formations.
The automated Stock Market of today with High Frequency Traders (HFTs) and Dark Pools has caused new candlestick patterns.
The new candlestick patterns developing on charts are due to several factors, which include the following:
- The increased use of High Frequency Trading venues on exchanges. This mostly affects Intraday and Day Trading, as High Frequency Trading action on the millisecond causes more gaps as well as sudden price reversals and whipsaws now than were present a few years ago.
- Dark Pools are off-the-exchange aka Over-the-Counter (OTC) transactions that are delayed orders not displayed on the exchange platforms. These are used by the giant Buy Side Institutions.
LEARN MORE at TechniTrader.Courses
Trade Wisely,
Martha Stokes CMT
TechniTrader technical analysis using a MetaStock chart, courtesy of Innovative Market Analysis, LLC dba MetaStock
Chartered Market Technician
Instructor & Developer of TechniTrader Stock & Option Courses
Copyright ©2017–2024 Decisions Unlimited, Inc. dba TechniTrader. All rights reserved.
TechniTrader is also a registered trademark of Decisions Unlimited, Inc.