
Where Is Support for Swing Trading Style Runs?
Stronger and Weaker Support Explained
Support and Resistance are often areas of Technical Analysis that are not fully understood. Swing Trading includes Momentum Runs, Velocity Runs, Volatile Runs, and Intraday Swing-Style Runs, each of which have their own Support and Resistance.
The chart example below had a Standard Swing Run out of an extreme sell-off price action.
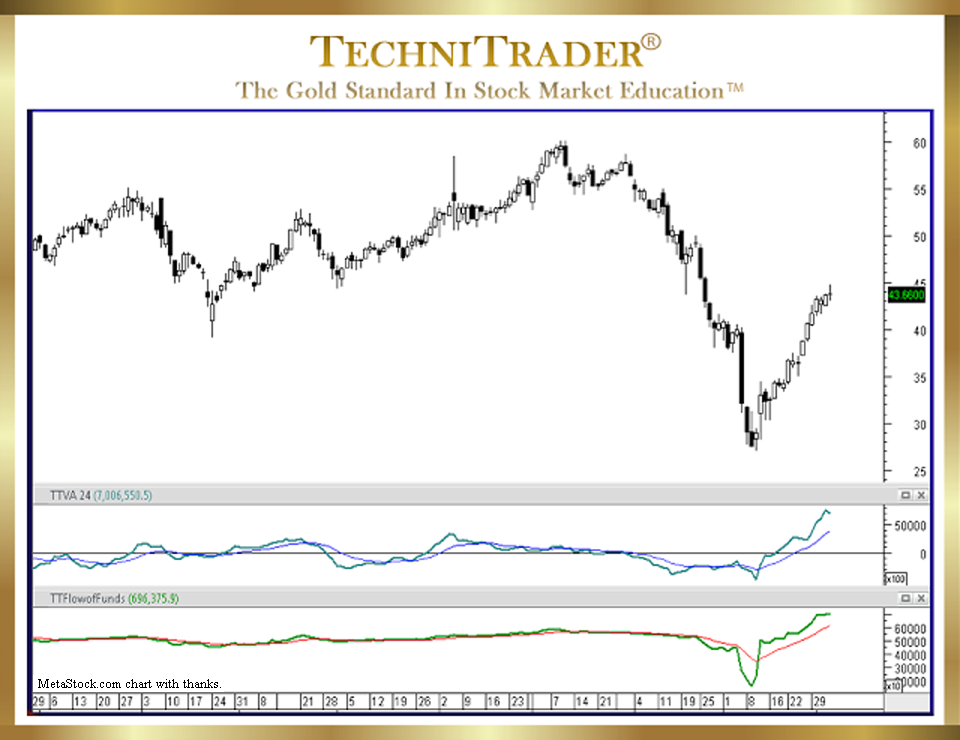
Selling was triggered by Volume Weighted Average Price (VWAP) orders, which activated as stock volume rose above average levels.
These are automated orders. There was no support to halt the run down until the stock fell into an earlier Dark Pool Buy Zone™ that formed a few months after it IPO’d.
This type of support for Swing Trading is stronger because more accumulation is likely at this level. As the stock ran in a Standard Swing Run pattern, twice it encountered two days of profit taking in between each day it ran up, forming a longer white candlestick the next day as it progressed.
This is weaker support even at the extreme sell-off conditions. The first run up has long tails and wicks, which is common when there is a mix of sellers and buyers that are almost equally weighted.
LEARN MORE at TechniTrader.Courses
Trade Wisely,
Martha Stokes CMT
TechniTrader technical analysis using a MetaStock chart, courtesy of Innovative Market Analysis, LLC dba MetaStock
Chartered Market Technician
Instructor & Developer of TechniTrader Stock & Option Courses
Copyright ©2017–2024 Decisions Unlimited, Inc. dba TechniTrader. All rights reserved.
TechniTrader is also a registered trademark of Decisions Unlimited, Inc.