How to Identify New Sell Short Topping Candlestick Patterns
Add Stock Volume & Quantity Indicators to Analysis
One of the challenges for Technical Traders is learning the new Topping and Bottoming Candlestick Patterns that have emerged in the past few years. The Topping Candlestick Patterns in the markets today can be a surprise for traders. Learning How to Identify New Sell Short Topping Candlestick Patterns is by including additional stock Volume and Quantity Indicators with those you are already using. These can improve your ability to see Dark Pool Quiet Rotation™ and selling pressure, which are not visible on the chart or indicators until after the stock drops sharply.
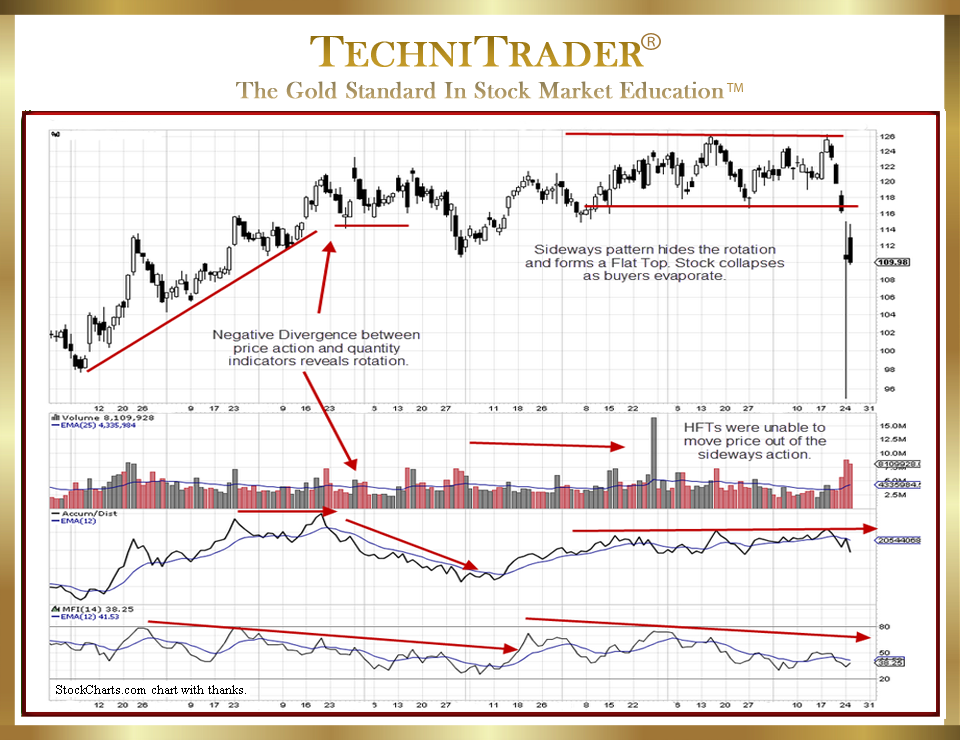
The stock chart example below has a new “Flat Top” Candlestick Pattern and is a good sell short example.

The top actually starts as the Accum/Dist and Money Flow Index (MFI) indicators diverge from price. This reveals Dark Pool Quiet Rotation by giant Buy Side Institutions whose orders are hidden from traders in Dark Pool venues. Price continues up as the institutions intend. As the buying power of Smaller Funds and uninformed Retail Traders dissipates, the Buy Side Institutions’ giant-lot orders selling in Dark Pool Quiet Rotation patterns weaken the uptrend, shifting it sideways. At first glance, this does not look anything like the Topping Candlestick Patterns every Retail Trader knows. It looks like sideways price action that is going to break to the upside.
The Money Flow Index indicator and other large-lot indicators reveal a negative divergence pattern, warning that this is indeed what is called a “Flat Top”. This is one of the New Sell Short Topping Candlestick Patterns in the markets today. Selling for profit quickly reverts to Selling Short and the stock collapses, then it quickly rebounds on Buy to Cover orders. However, the stock chart indicators still reflect a sell side pressure.
LEARN MORE at TechniTrader.Courses
Trade Wisely,
Martha Stokes CMT
TechniTrader technical analysis using a StockCharts chart, courtesy of StockCharts.com
Chartered Market Technician
Instructor & Developer of TechniTrader Stock & Option Courses
Copyright ©2017–2025 Decisions Unlimited, Inc. dba TechniTrader. All rights reserved.
TechniTrader is also a registered trademark of Decisions Unlimited, Inc.
