
How to Swing Trade Springboard Candlestick Patterns
Use Balance of Power Indicator to Reveal Dark Pool Quiet Accumulation
A Velocity Market Condition is one of the shortest of the 6 Primary Market Conditions. The reason that a Velocity Condition is so brief is because of how fast price moves, how quickly the Angle of Ascent™ goes vertical, and the speed at which stock volume and energy evaporate.
Velocity Runs are spectacular, can earn an experienced and educated trader high profits, and can be a lot of fun to trade. Velocity is strictly for Swing Trading, Momentum Trading, and Day Trading. If a stock moves with Velocity and it was a Position Trade, then the trader needs to adjust how they are trading that stock.
The candlestick chart example below enjoyed a highly profitable Velocity Run following the entry signal called a Springboard Candlestick Pattern.
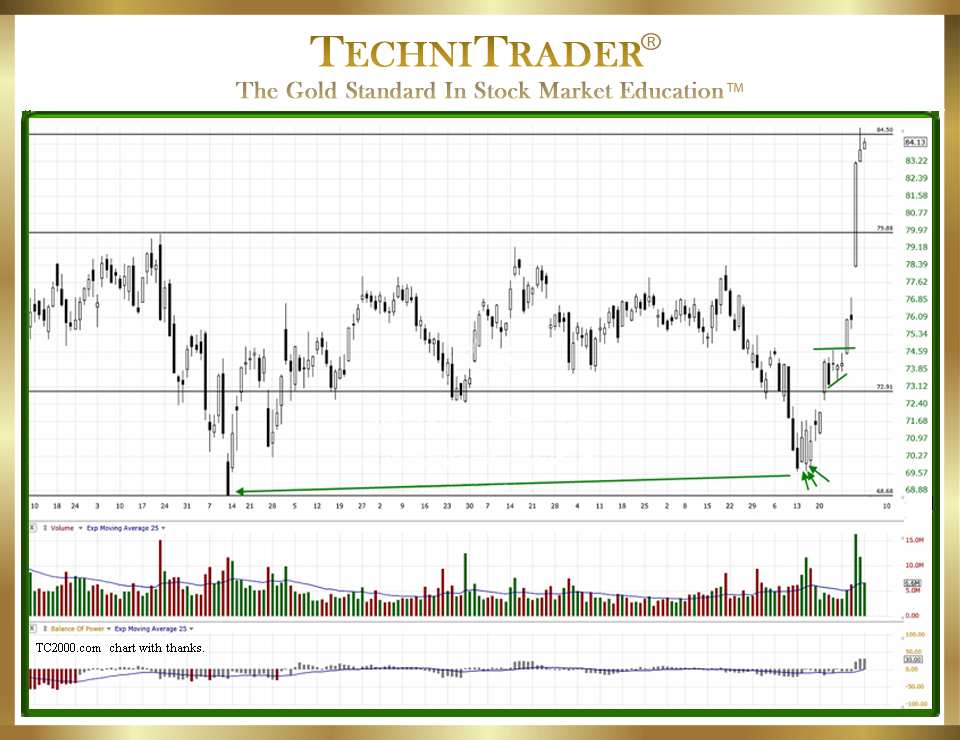
Nearly all Velocity Runs are instigated and controlled by High Frequency Traders (HFTs). The Velocity Run occurs when High Frequency Traders discover that Dark Pools have been buying a stock. The NEW Western Candlestick Patterns™ are the key elements in the candlestick chart example above.
Over 80% of all market activity today is automated orders that trigger on specific technical or fundamental conditions. Therefore, Retail Traders should use the NEW Western Candlestick Patterns to identify when a stock is about to move with Velocity or Momentum. One such example is the entry signal called a Springboard Candlestick Pattern.
In older Candlestick Pattern books and articles, candlesticks are used solely for reversal or continuation analysis. However, in the automated markets of today, candlesticks are far more reliable and should be used as the entry signal rather than using crossover indicators which are totally outdated and lagging.
The candlestick chart example shows ample Dark Pool Quiet Accumulation revealed in the Balance of Power (BOP) indicator located in the bottom chart window. Dark Pool buying incrementally stopped the selling down, halting the downside suddenly and just above the prior low as indicated by the green arrows.
LEARN MORE at TechniTrader.Courses
Trade Wisely,
Martha Stokes CMT
TechniTrader technical analysis using a TC2000 chart, courtesy of Worden Bros.
Chartered Market Technician
Instructor & Developer of TechniTrader Stock & Option Courses
Copyright ©2017–2025 Decisions Unlimited, Inc. dba TechniTrader. All rights reserved.
TechniTrader is also a registered trademark of Decisions Unlimited, Inc.