Currently browsing tag

Support and Resistance

Where Is Support for Swing Trading Style Runs?

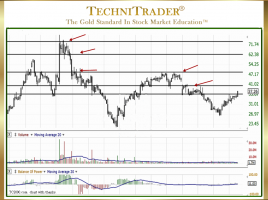
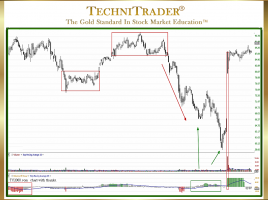
Stronger and Weaker Support Explained Support and Resistance are often areas of Technical Analysis that are not fully understood. Swing Trading includes Momentum Runs, Velocity Runs, Volatile Runs, and Intraday Swing-Style Runs, each of which have their own Support and Resistance. The chart example below had a Standard Swing Run …

Where Is Support and Resistance for Position Trading?

Compression Candlestick Patterns Caused by Technical & Fundamental Traders Position Trading support and resistance are caused by the effect of Technical and Fundamental Traders in the stock. A “compression” pattern is a new candlestick pattern where a group of candlesticks indicate that the stock is poised for a sudden move, …

Why Use Stock Volume to Reveal Weak Candlestick Patterns?

How Retail Traders Avoid Whipsaw Trades Many traders still rely solely upon Price and Price Indicators, which leaves them highly vulnerable to whipsaw trades. Stock Volume reveals weak candlestick patterns, and so it is critical to use it in the automated markets today. This is because the giant Buy Side …

How to Read a Candlestick Chart for Stock Trading

List of 5 Tips About Price Action Revealed A skill that all traders need to hone and strive to improve constantly is how to read a candlestick chart for stock trading. Candlestick patterns of price action matter. What price is doing tells a great deal about which Stock Market Participant …

How to Analyze Stock Support and Resistance

Comparing Price Action with Leading Indicators During a downtrend, traders need to be able to determine if a big white candlestick is a true Reversal back to an uptrending pattern or if it is just momentary Rebound price action caused by Buy the Dip Investors and Buy to Cover Traders. …

What Are the 5 Key Aspects of Technical Analysis?

Candlestick Patterns Reveal Who, What, Where, When, and Why Technical Analysis is the study and interpretation of price, time, and stock volume for stocks and indexes. Due to the massive changes to the Stock Market Structure since the Banking Debacle and Subprime Mortgage disaster, Technical Analysis has been evolving and …

What Is Missing in Your Risk Analysis?

Stop Loss with Support & Resistance The least used and most often improperly used analysis by Technical Traders and Retail Traders is Risk Analysis. All too often, traders are choosing high-risk stock picks without realizing it. See the candlestick chart example below. This analysis is NOT using percentages, but rather …