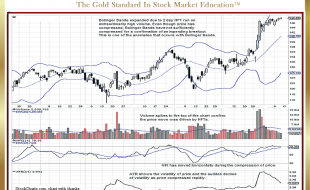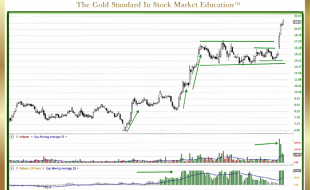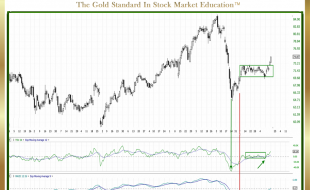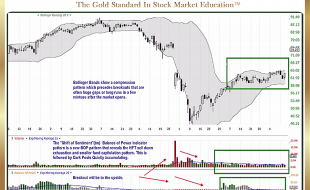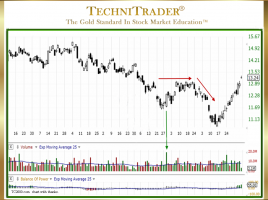
Why Recognize MACD Contrarian Indicator Patterns?

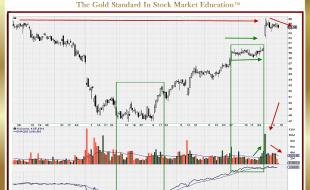
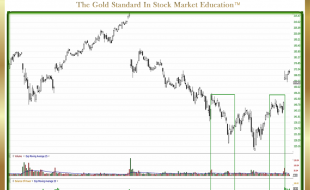
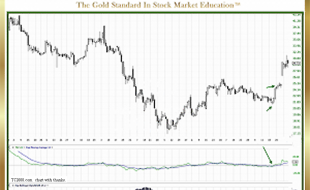
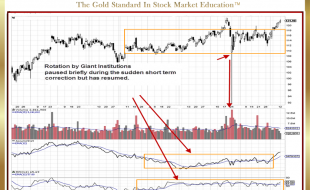
Sideways Candlestick Pattern Breakout Direction Oftentimes, traders may be confused with conflicting indicator patterns. Contrarian patterns between indicators and between Price and stock Volume-based Indicators are very common these days. In the stock chart example below, the stock gapped up on earnings news and shifted to a sideways candlestick pattern …

STOCK TRADING TRAINING! Beginners start here!

STOCK TRADING TRAINING! Introduction to Trading: Learn How to Trade Stocks Login or Sign Up   TechniTrader The Gold Standard in Stock Market Education™ Trade Wisely, Martha Stokes CMT TechniTrader.Courses Chartered Market Technician Instructor & Developer of TechniTrader Stock & Option Courses Copyright ©2019–2025 Decisions Unlimited, Inc. dba TechniTrader. All …

19 pages