Currently browsing author

Martha Stokes CMT

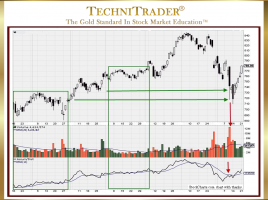
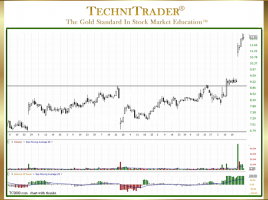
What Is Dark Pool Quiet Rotation™?

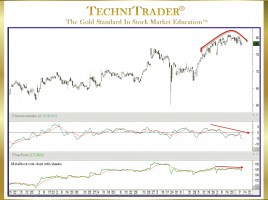
Candlestick Patterns Explained with Stock Indicators Most Technical and Retail Traders have heard about Buy Side Institutions’ Dark Pool Quiet Accumulation and Quiet Distribution, but few understand another institutional action which is Dark Pool Quiet ROTATION. The candlestick chart example below with a monthly view shows the commencement of a …

STOCK TRADING TRAINING! Beginners start here!

STOCK TRADING TRAINING! Introduction to Trading: Learn How to Trade Stocks Login or Sign Up   TechniTrader The Gold Standard in Stock Market Education™ Trade Wisely, Martha Stokes CMT TechniTrader.Courses Chartered Market Technician Instructor & Developer of TechniTrader Stock & Option Courses Copyright ©2019–2025 Decisions Unlimited, Inc. dba TechniTrader. All …

Why Use Stock Volume to Reveal Weak Candlestick Patterns?

How Retail Traders Avoid Whipsaw Trades Many traders still rely solely upon Price and Price Indicators, which leaves them highly vulnerable to whipsaw trades. Stock Volume reveals weak candlestick patterns, and so it is critical to use it in the automated markets today. This is because the giant Buy Side …

Why Analyze Sideways Bottoming Stock Trends?

To Identify Dark Pool Buy Zones™ The Shift of Sentiment™ pattern in the stock chart example below clearly and easily shows that Buy Side Institutions using Dark Pools entered this stock and would quickly take control of price. Sideways bottoming stock trend analysis of the chart shows that a sudden …

How to Read a Candlestick Chart for Stock Trading

List of 5 Tips About Price Action Revealed A skill that all traders need to hone and strive to improve constantly is how to read a candlestick chart for stock trading. Candlestick patterns of price action matter. What price is doing tells a great deal about which Stock Market Participant …

19 pages