New Candlestick Patterns Revealed for Investors and Traders
Changing Topping and Bottoming Formations
In the past few years Technical Analysis has undergone some significant changes. Many traditional technical patterns are either not forming as often, not as reliable, or are simply not found on the charts. Bottoming and Topping Formations have undergone the most substantial changes. Some Bottoms and Tops are rarely seen, some do not reverse the trend or only reverse it for a brief period of time, while others that were once common do not form at all.
These changes have been subtle and have been going on slowing for several years so these changes are often missed by individual investors or retail traders. Not recognizing these critical trend reversal technical patterns and how they are changing, can affect investing and trading profits.
Why the traditional Bottoms and Tops are no longer forming on stock charts as they once did, is just as important as recognizing which of the Bottoming and Topping formations have been altered or lost.
The Bottoming and Topping formations are critical areas of a trend, and recognizing these patterns early on is the key to successful investing and trading. If a Topping formation pattern has started but an individual investor or retail trader is unaware or doesn’t recognize it, an entry at that point could cause a huge loss.
Conversely, not recognizing Bottoms as they are developing often leads to missed opportunities, as stocks tend to run faster and longer out of Bottoms in the current market structure.
Bottoming and Topping patterns are the most sensitive to changes in the Market Participant Groups and the Market Participant Cycle. This is because these are major pivotal points where a Shift of Sentiment™ occurs for the most important of all the nine Market Participants, which is the Institutional Investor.
Since there are two primary types of giant institutions, the Buy Side Institutions and the Sell Side Institutions these huge lot investors can and do alter technical patterns.
One of the candlestick patterns that rarely forms in the automated stock market of today is the Head and Shoulders Top. The market is dominated now by Dark Pools who use targeted price zones and specialized orders that insure their giant lots do not move price, and the High Frequency Traders HFTs who use special orders designed specifically for millisecond trading that is intended to move price rapidly with huge velocity runs. These cause the Head and Shoulders Topping formation to be disrupted before it can fully develop.
The Dark Pools often are in total control of price at Bottoms. With their precise targeted price zone, price is so tightly compacted with their huge lot orders that Bottoms have altered dramatically. Inverse Head and Shoulders are extremely rare, W Bottoms are shallower and harder to identify, and Triple Bottoms have disappeared. New formations are replacing these older style Bottoms.
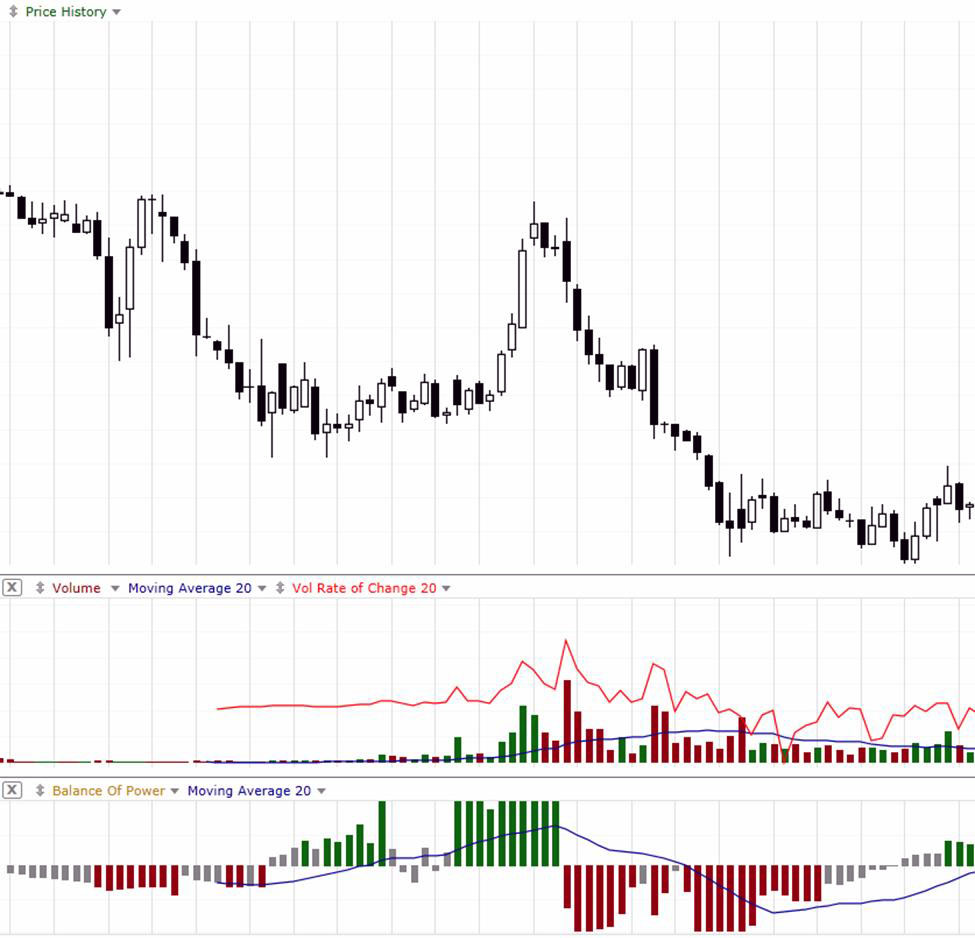
Basing Bottoms, U Bottoms, Velocity Bottoms, and Quiet Accumulation Bottoms are just a few of the new Bottom formations to recognize and enter early before the huge momentum runs that follow. The chart example below is one of the new Bottoming patterns, which when identified early offers strong profit as it completes.
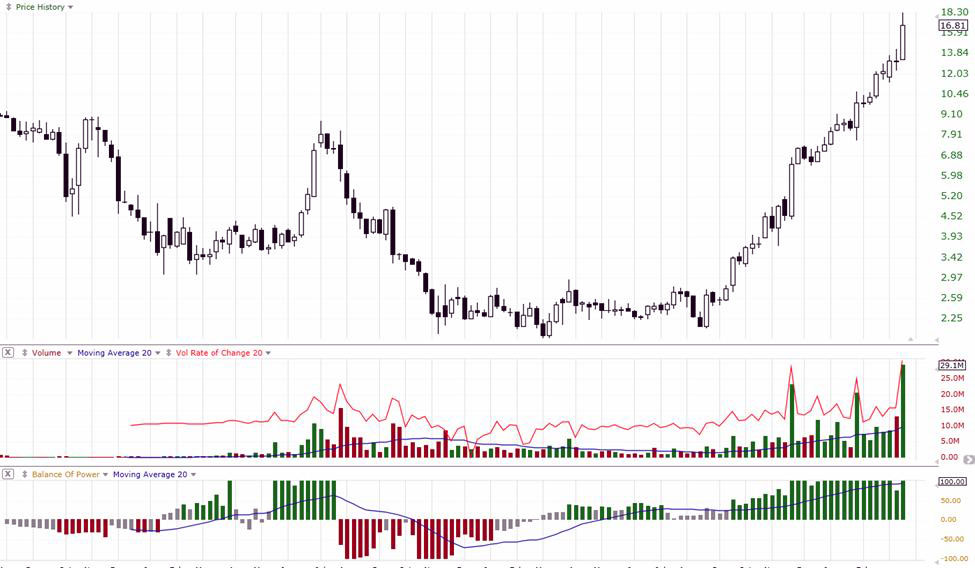
 The chart example below shows the completed Bottom of the same stock, and the subsequent momentum run.
 Summary
Of all retail traders there are 90% of them who lose money, while 90% of all professionals are making excellent income. Using current Technical Analysis intended for the electronic marketplace of today helps individual investors and retail traders enjoy high profits like most professionals. The difference is that professionals continually keep up on changes in candlestick stock charts that are revealed in Technical Analysis patterns.
Candlestick Patterns have been changing over the past several years. This is due to new professional orders, new ways to automate giant lot orders, and millisecond trading techniques as well as algorithms that alter how, when, and where stocks are bought and sold.
There is a huge evolution going on in the internal market structure, where over 90% of all the orders are processed automatically. Most orders are triggered by a computer rather than a manual entry by a human. This means that Candlestick Patterns have changed dramatically in just the last decade. Some Candlestick Patterns from the traditional Japanese Candlesticks rarely form in our automated marketplace anymore, while others have become less reliable than they were even a few years ago.
The New Candlestick Patterns offer far superior Entry and Exit signals. Some of the new Candlestick Patterns are the Pole Vault, Hurdle, Nesting Pattern, Resting Day, Springboard, and Sandwich.
I invite you to visit my website at www.TechniTrader.Courses
Trade Wisely,
Martha Stokes CMT
TechniTrader technical analysis using TC2000 charts, courtesy of Worden Bros.
Chartered Market Technician
Instructor & Developer of TechniTrader Stock & Option Courses
Copyright ©2017–2025 Decisions Unlimited, Inc. dba TechniTrader. All rights reserved.
TechniTrader is also a registered trademark of Decisions Unlimited, Inc.
Disclaimer: All statements, whether expressed verbally or in writing are the opinions of TechniTrader its instructors and or employees, and are not to be construed as anything more than an opinion. Readers are responsible for making their own choices and decisions regarding all purchases or sales of stocks or issues. TechniTrader is not a broker or an investment advisor; it is strictly an educational service.
