How to Interpret Linear Regression Slope Lines
Price Fluctuation Revealed
Linear Regression Slope Lines can provide a visual interpretation of price that is far superior to any moving average. Instead of applying the lines to the price, the lines can be set below the price chart to maintain the integrity of the analysis of the candlestick patterns that are forming.
Linear Regression Slope Lines use the formula of Linear Regression Lines for defining a straight line relation value between two periods of price over time. The LRS lines help individual investors and retail traders see quickly how much price has fluctuated over time.
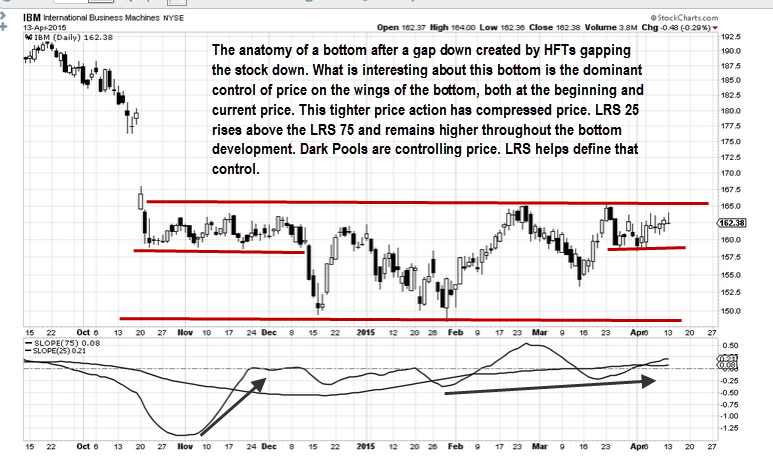
See the chart example below of International Business Machines (NYSE: IBM) which has percent shares held by institutions of 61%.
The LRS lines in the chart window below the IBM price chart clearly show a huge fluctuation of price in November, as the first test of the low for a potential bottom occurs. The shorter LRS line shows sell shorters that a bottom extreme is highly likely. The price drops in December and quickly recovers due to a prior buy zone of Dark Pools triggering their automated Time Weighted Average Price (TWAP) orders at the lower level. The LRS lines remain high throughout the next couple of months, as the stock develops a short term shallow W bottom. The highs of the bottom are clearly defined by the gap and the stock turns down as it touches the highs of the range; however, it fails to make lower lows.
The candlestick pattern shows how controlled price is during certain phases of the bottom. There is a compression of price after the gap down into a tight formation with very consistent highs and lows, followed by a testing of lower lows, and then the current price in a tighter formation again.
The LRS lines show that price is not sloping as deeply as it may appear on the price chart, but is maintaining near or above the longer LRS line and angling upward over time.
Summary
LRS lines are useful for revealing a different perspective and view of price. Rather than just smoothing price action as moving averages do, LRS lines can actually show a trend before it is easily recognized. This makes LRS lines a good tool to use for individual investors and retail traders who are still working on developing their Spatial Pattern Recognition Skills™ in chart analysis.
I invite you to visit my website at www.TechniTrader.Courses
Trade Wisely,
Martha Stokes CMT
Chartered Market Technician
Instructor & Developer of TechniTrader Stock & Option Courses
Copyright ©2017–2025 Decisions Unlimited, Inc. dba TechniTrader. All rights reserved.
TechniTrader is also a registered trademark of Decisions Unlimited, Inc.
Disclaimer: All statements, whether expressed verbally or in writing are the opinions of TechniTrader its instructors and or employees, and are not to be construed as anything more than an opinion. Readers are responsible for making their own choices and decisions regarding all purchases or sales of stocks or issues. TechniTrader is not a broker or an investment advisor; it is strictly an educational service.

