How to Recognize Weakness in a Sideways Candlestick Pattern
Use Stock Volume and Leading Indicators
Stocks and the Stock Market move sideways about 70% of the time. Yes, some stocks get into periods of moderately trending activity. However, if you really look at charts just to see the 3 trends of Uptrending, Downtrending, and Sideways, you will see that stocks are in some kind of sideways candlestick pattern most of the time.
Traders do not spend sufficient time learning how to recognize which of the several types of sideways action is underway. Being able to accurately determine what type of sideways action is forming before the sideways candlestick pattern completes will help tell you which direction the price will move, either the Uptrend Breakout or the Downtrend Breakout.
In order to really determine the direction for the breakout in recognizing weakness in a sideways candlestick pattern, you must use more than Price Indicators.
Price Indicators are incapable of leading price because price must move in that direction before the indicator can show that in its line graph.
Shortening the period settings does not make the Price Indicator lead; rather, it merely makes the Price Indicator overreactive to every price directional change that occurs naturally in the Daily View or Intraday View of charts.
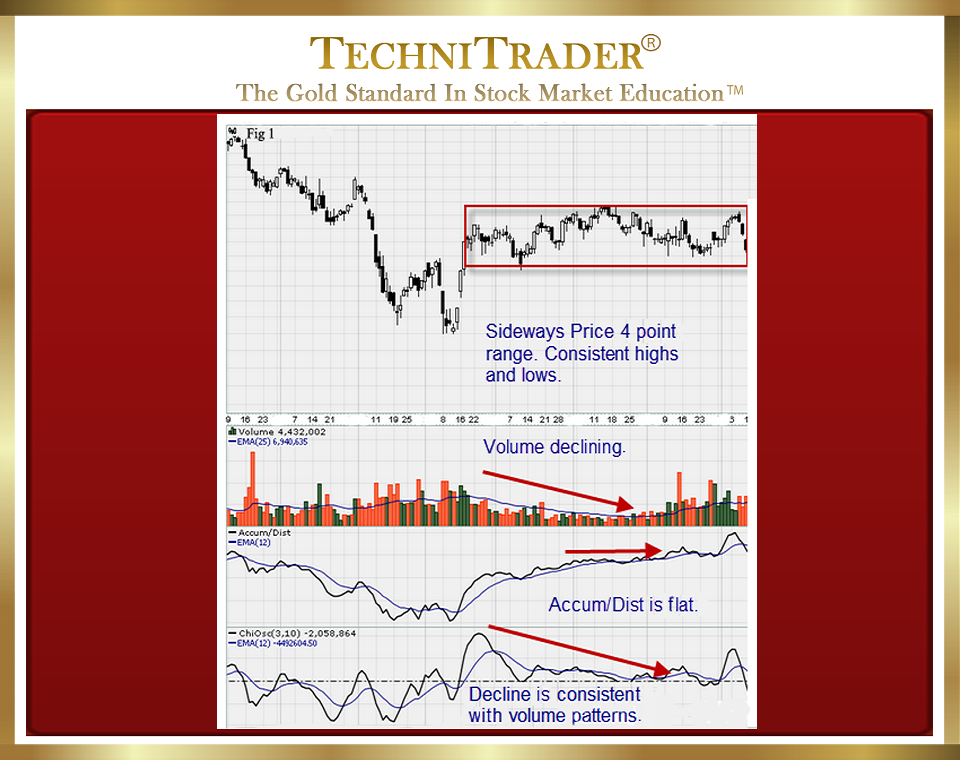
Chart example #1 below shows a sideways candlestick pattern that is 4 points wide.

This chart has a typical Platform Candlestick Formation. The assumption might be that the stock will break to the upside due to the presence of giant Buy Side Institutions using Dark Pools. That would be only if you considered Price and did not check stock Volume Indicators, which reveal if the Dark Pools are in Quiet Accumulation, Rotation, or Distribution mode.
When studying the stock Volume Indicators for chart example #1 above, there is clear evidence that, while there are some Smaller Funds buying, stock Volume overall is declining due to large lots selling as this stock moves sideways in a fairly tight range.
LEARN MORE at TechniTrader.Courses
Trade Wisely,
Martha Stokes CMT
TechniTrader technical analysis using StockCharts charts, courtesy of StockCharts.com
Chartered Market Technician
Instructor & Developer of TechniTrader Stock & Option Courses
Copyright ©2017–2025 Decisions Unlimited, Inc. dba TechniTrader. All rights reserved.
TechniTrader is also a registered trademark of Decisions Unlimited, Inc.
