
What Are Candlestick Patterns of Stock Market Participant Groups?
Time Progression Stock Chart Examples Explained
Within this article are “time progression” stock chart examples of one stock to help readers focus on the candlestick patterns of the Stock Market Participant Groups. Each of the groups discussed create certain candlestick patterns in the charts. Therefore, a portion of the chart has been covered in stock chart examples #1 and #2, creating a white space on the right side.
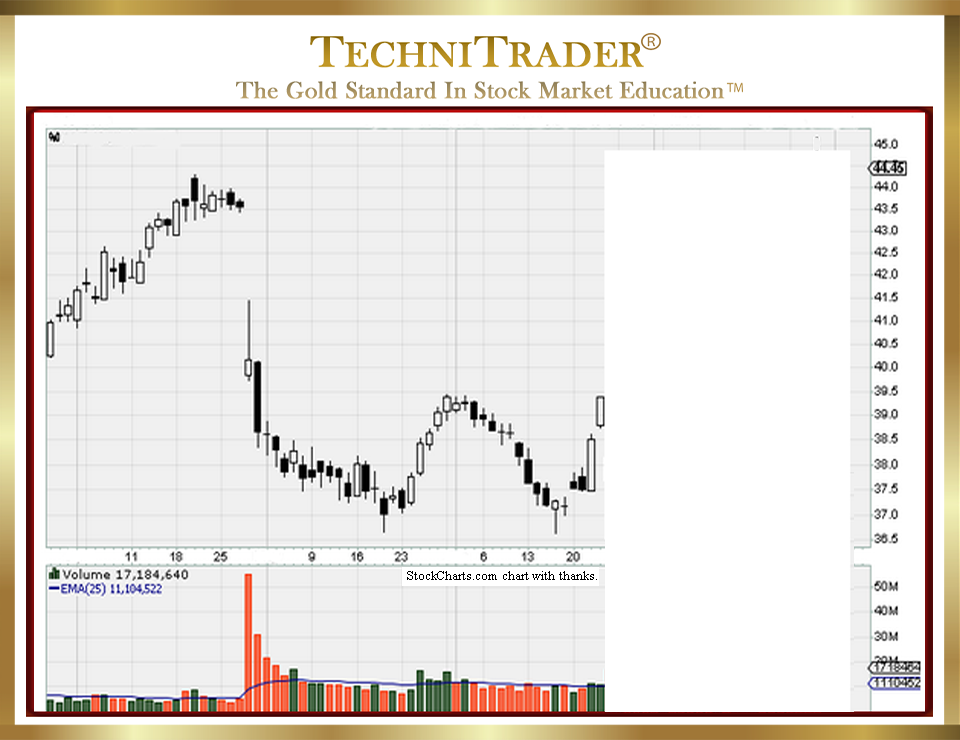
Stock chart example #1 above has a huge gap down and then a candlestick with a long wick and a small white body. Volume has spiked to the top of the Volume bars indicator window on unusually high red or “down day” Volume.
This is a High Frequency Traders (HFTs) Stock Market Participant Group footprint, and it should be obvious on any chart. It was preceded by a runaway trendline pattern which was speculative. Usually, this type of gap is either news or an earnings gap; however, High Frequency Trading can also trigger in the wrong direction.
The next day is an extraordinarily long black candlestick that gaps slightly at open, falls for the remainder of the day, and then moves up slightly in the last couple of trading minutes. The next several days are small black candlesticks with two small white candlesticks.
However, price is not running down; instead, it is shifting sideways. This is a big signal that even though price appears to be moving down, it is actually being supported by buyers with sufficient capital resources and powerfully controlled orders to hold the stock at this level. These are the Buy Side Institutions Stock Market Participant Group using Dark Pool Alternative Trading Systems (ATSs) off the exchanges. If these large-lot buyers were not countering the selling, then price would be collapsing.
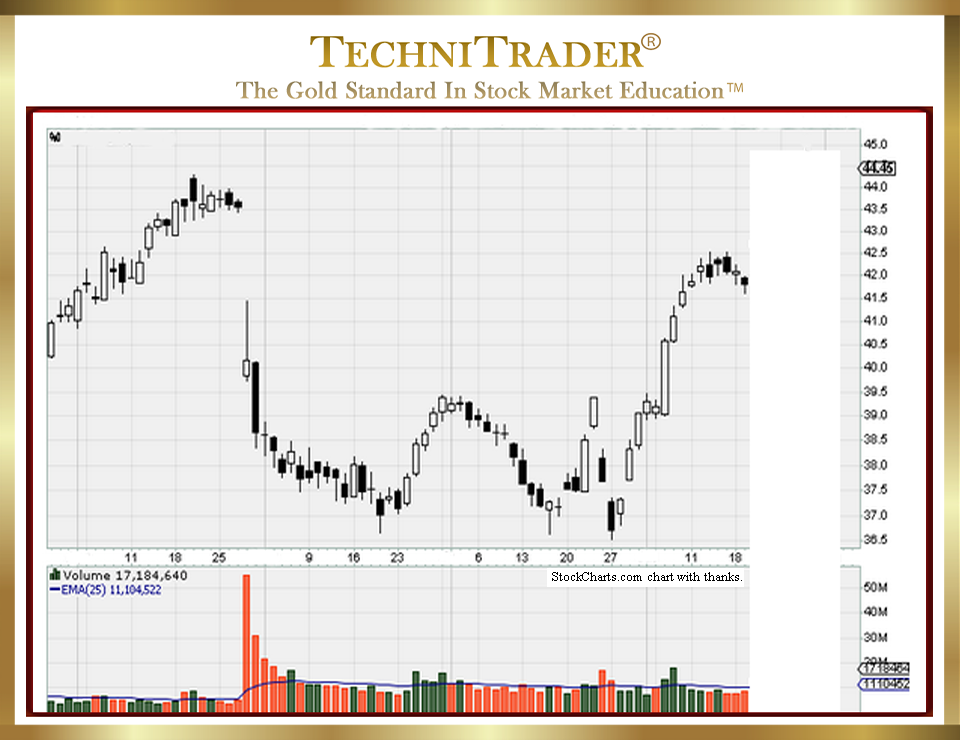
The stock moves down slightly further the next day, and then it recovers with a candlestick that has a tail that is as long as the body. The next few resting days convert to a run up with small candlesticks. Again, we see control of the entry Price and stock Volume just above the average line. The Buy Side Institutions Stock Market Participant Group’s larger-lot buyers took control of price and the sellers evaporated, causing the buying to be revealed as the Professional Traders Stock Market Participant Group of buyers moved in.
However, the stock stalls at around $39 and slip slides down. This is partly profit taking and partly a void of large-lot buyers. As the large-lot buyers halted their automated orders at a specific high price and with the Professional Traders Stock Market Participant Group taking short-term profits, the stock inches down but does not run down.
The stock now moves down to the prior low, forms another small-body candlestick with a long tail that is white this time, and then runs back up close to the prior high. Now, you should see that there is a PATTERN here. This StockCharts.com Candlestick Pattern Analysis shows that the Buy Side Institutions Stock Market Participant Group’s larger lots are controlling their entry price and the high range they will pay for the stock. This is important for Swing Traders, Day Traders, and even Position Traders to recognize.
Profit taking starts again, the Buy Side Institutions Stock Market Participant Group’s large-lot buyers halt their buying, and the stock gaps down, going a bit lower this time. However, this dip is beyond the prior low buy-in price. This triggers more large-lot buying with a gap and a run that again halts near a previous high where large-lot buyers previously stopped buying. These are Buy Side Institutions Stock Market Participant Group automated orders triggering on price and halting at price levels.
There have now been 3 hits on the high of the Dark Pool Buy Zone™ range of buying. Often, that is all that is needed to expose the liquidity draw of the large-lot accumulation by the Buy Side Institutions group.
LEARN MORE at TechniTrader.Courses
Trade Wisely,
Martha Stokes CMT
TechniTrader technical analysis using StockCharts charts, courtesy of StockCharts.com
Chartered Market Technician
Instructor & Developer of TechniTrader Stock & Option Courses
Copyright ©2017–2025 Decisions Unlimited, Inc. dba TechniTrader. All rights reserved.
TechniTrader is also a registered trademark of Decisions Unlimited, Inc.