
MACD Trading Strategies for Bottoming Entries
Types of Indicators to Use After a Downtrend
One of the tougher things to learn in trading is the right time to enter a stock after a long downtrend. Many times, traders are too eager and get into a stock that looks as if the bottom is well underway, but then they discover that the stock does not move as they expected. The chart example below formed a Rounding Top candlestick pattern, and it has been trending since then.
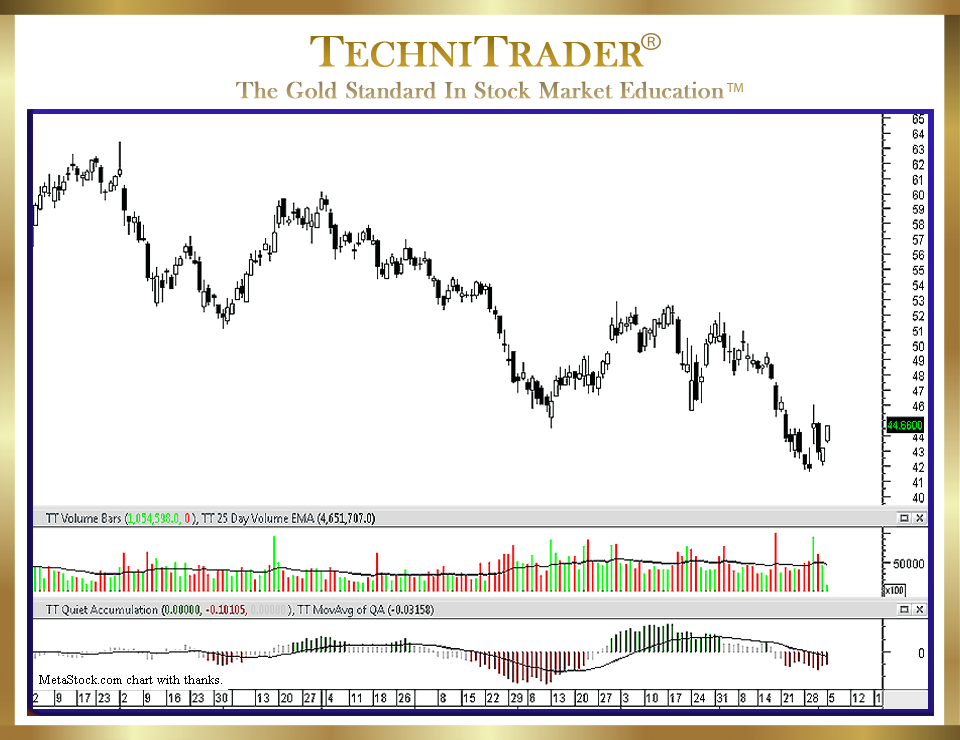
It started moving sideways in what many traders who use MACD thought was the end of the downtrend with the likelihood of momentum upside energy.
Trading Strategies for Bottoming Entries using MACD based on standard settings of 12 and 26 with an Exponential Moving Average (EMA) of 9 indicated an entry crossover signal. However, instead of running with momentum as traders were expecting, the price moved sideways for over a week, barely moving from the original entry price. It moved up slightly, and then it moved down the following week with MACD lagging as an exit signal for a losing trade.
What Technical Traders are missing when using MACD as their entry indicator in Trading Strategies for Bottoming Entries is Quantity Data. This is one of the most important pieces of data that comes from the market, yet it is rarely used, and very few indicators include Quantity in their formulas.
LEARN MORE at TechniTrader.Courses
Trade Wisely,
Martha Stokes CMT
TechniTrader technical analysis using a MetaStock chart, courtesy of Innovative Market Analysis, LLC dba MetaStock
Chartered Market Technician
Instructor & Developer of TechniTrader Stock & Option Courses
Copyright ©2015–2024 Decisions Unlimited, Inc. dba TechniTrader. All rights reserved.
TechniTrader is also a registered trademark of Decisions Unlimited, Inc.