
How to Find Stocks to Trade Quickly
TechniTrader Scans Provide Market Condition and Stock Picks
The first and most important thing is to determine the current Market Condition of the six conditions which can occur in the market today. I developed a tool for doing this for Individual Investors and Retail Traders called the “TechniTrader Market Condition Analysis Scans”, which can be installed into TC2000 and MetaStock charting software programs. Analyzing these scans takes just a few minutes in order to determine the current Market Condition.
Once the current Market Condition is determined, then choose the scan that is suitable for that particular condition and your personal Trading Style to look through for stock picks to invest or trade. Finally, decide which strategy to apply for each stock pick depending on the current Market Condition.
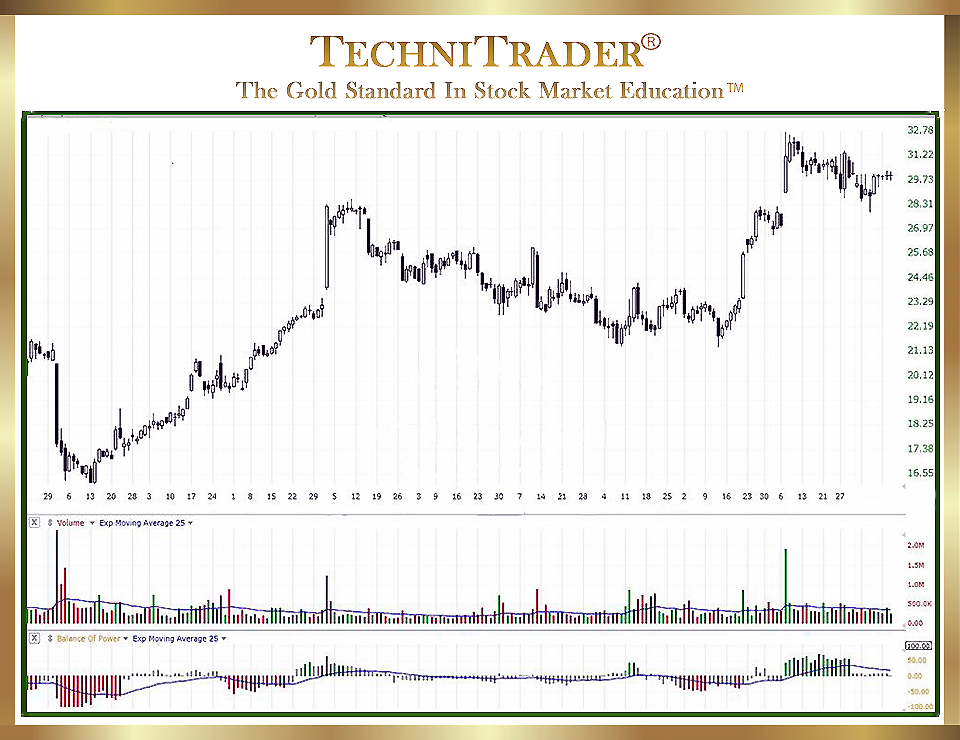
It is important to find quality stock picks quickly and assess their potential just by looking at the stock chart. The TC2000 chart example below demonstrates this conceptual analysis for finding stocks quickly.
Here is a one-day example of how fast this process can be done using TechniTrader Market Condition Analysis Scans:
- TechniTrader Momentum Buy Scan: Shows all of the stocks moving with momentum to the upside. However, out of almost 6,000 stocks in the market on this particular day, the total result in this scan is 130 stock charts.
- TechniTrader Momentum Sell Scan: Shows all of the stocks moving with momentum to the downside. However, out of almost 6,000 stocks in the market on this particular day, the total result in this scan is 45 stock charts.
Just that quickly, the Bias of the market, which is up and lacking momentum, is revealed after looking at the results in these two scans. Either one of these two scans must have a total result of 150–400 stock charts for momentum to exist either to the upside or downside. - TechniTrader Institutional Scan: Shows whether the Buy Side Institutions are buying quietly in Dark Pools, if High Frequency Traders (HFTs) are extremely active creating speculative trading, or if Smaller Funds and Retail Traders control price.
It has a total result of 173 stock charts on this day, which is a low number, and it indicates that there are predominantly High Frequency Traders controlling price with Smaller Funds and retail chasing after them.
LEARN MORE at TechniTrader.Courses
Trade Wisely,
Martha Stokes CMT
TechniTrader technical analysis using TC2000 charts, courtesy of Worden Bros.
Chartered Market Technician
Instructor & Developer of TechniTrader Stock & Option Courses
Copyright ©2017–2024 Decisions Unlimited, Inc. dba TechniTrader. All rights reserved.
TechniTrader is also a registered trademark of Decisions Unlimited, Inc.