
How to Decode a Candlestick Chart with Doji
Use Pure Price as Entry & Exit Signals
When Candlestick Charts were first introduced to the western markets, everyone using Stock Charts and Technical Analysis relied on indicators more than Bar Charts, which were the most popular charts back then. Bar Charts are much harder to read, give less visual data, and take longer to interpret. Candlestick Charts were instantly popular because they made reading price fast and simple.
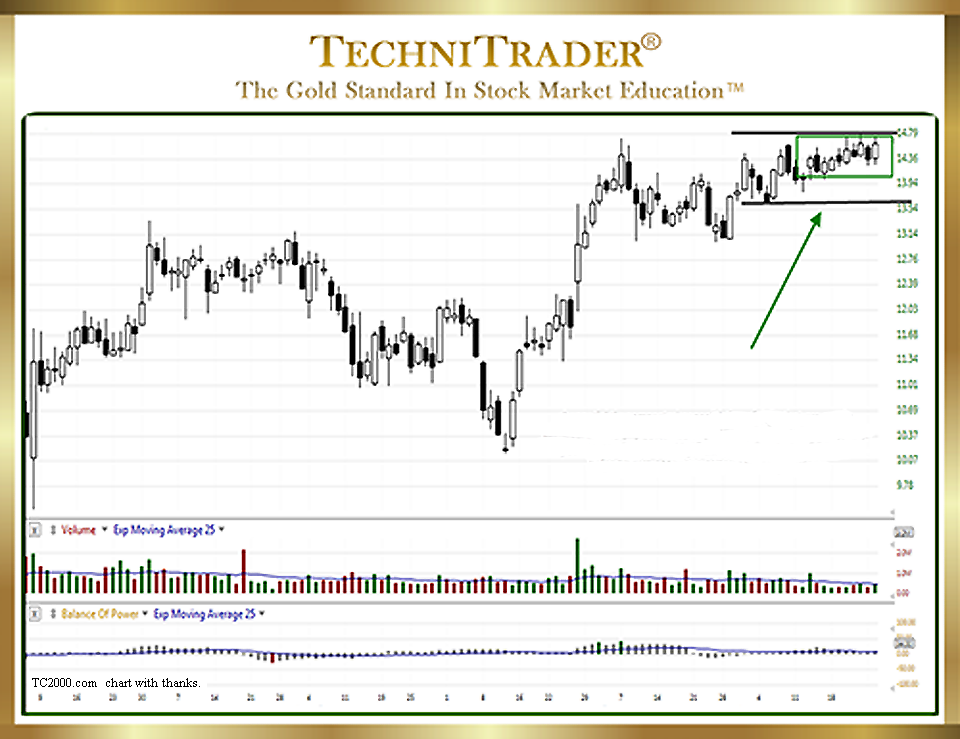
See the candlestick chart example below with a series of Doji, which indicates Dark Pools controlling price.
LEARN MORE at TechniTrader.Courses
In the beginning, candlesticks were assumed to be the confirming indicator making pure price subordinate to indicators such as MACD and Stochastic, which are both very popular indicators. However, using candlesticks as the entry signal rather than just confirming a continuation of the trend or a reversal of the trend enables traders to use pure price as their entry and exit signals.
Spatial Pattern Recognition Skills™ are something most traders do not have, and need to develop. It takes a while to learn how to read candlesticks as quickly and as easily as you are reading this text, but when you can do so, it opens up a world of information about why price is moving as it is and how it will move next.
Especially during Trading Range Market Conditions, having keen Spatial Pattern Recognition Skills is imperative. Otherwise, the markets seem merely volatile, unpredictable, and confusing.
LEARN MORE at TechniTrader.Courses
By learning Spatial Pattern Recognition Skills, you can speed up the entire analysis process and find strong stock picks for trading. Everyone who uses candlesticks knows what a Doji is; however, where it forms in a Candlestick Pattern can reveal a great deal. Decoding a Candlestick Chart with Doji can indicate any of the following:
- A Resting Day Candlestick and the stock will continue moving down
- An Exhaustion Pattern in which the stock will reverse
- Can expose Dark Pools controlling price
Dark Pool Quiet Accumulation is easy to recognize in a candlestick formation once it is understood how giant Buy Side Institutions using Dark Pools buy and sell. The patterns become obvious and are instantly and easily recognized. The candlestick chart example above shows the tight formation of Doji candles first being white, then black, and then white again, which is a Dark Pool Quiet Accumulation Pattern.
Since this is a compression consolidation of Doji, it is also indicating a likely Breakout Pattern. The stock may either run with High Frequency Trading triggers or gap. Entering early in this tight consolidation of Doji ensures that the trade is executed before a potential run or gap.
The more compression there is, then the more velocity behind the breakout with the pattern definitely favoring an Upside Breakout. The way the Doji have formed in the candlestick chart example above tells the Technical Trader with strong Spatial Pattern Recognition Skills that this is an Upside Breakout about to occur soon.
Summary
The candlestick chart example above also gives other information regarding how to Decode a Candlestick Chart with Doji. The stock has bottomed decisively and recently. It has no strong resistance above price. The tight consolidation of Doji was preceded by speculative trading triggered first by Professional Traders, then High Frequency Traders (HFTs), followed by Smaller Funds. The stock went sideways as Professional Traders took profits while Smaller Funds bought. Now, it is in a very tight formation. The control of price requires a very specific stock order type that only Dark Pools use regularly.
LEARN MORE at TechniTrader.Courses
If you have not yet begun to trade or invest, go to Introduction: Learn How to Trade Stocks – Free Video Lesson to get started.
Learn the steps to trade like a pro with this introductory mini course. You will learn what it takes to create a Professional Trading Plan that can help you achieve your trading goals: How to Create a Professional Trading Plan
Trade Wisely,
Martha Stokes CMT
TechniTrader technical analysis using a TC2000 chart, courtesy of Worden Bros.
Chartered Market Technician
Instructor & Developer of TechniTrader Stock & Option Courses
Copyright ©2017–2024 Decisions Unlimited, Inc. dba TechniTrader. All rights reserved.
TechniTrader is also a registered trademark of Decisions Unlimited, Inc.