
Why Is the Weekly Chart View Invaluable?
For Interpreting What Price Will Do After Stock Volume Spikes
The chart example below with a Daily Chart View shows that High Frequency Traders (HFTs) caused a huge white candlestick and stock Volume spike, as indicated by the vertical red line on the right. Since then, this stock has been in a sideways price action that has slowly slipped down to the previous high’s support level, which is underlined in black and indicated by the horizontal red arrow.
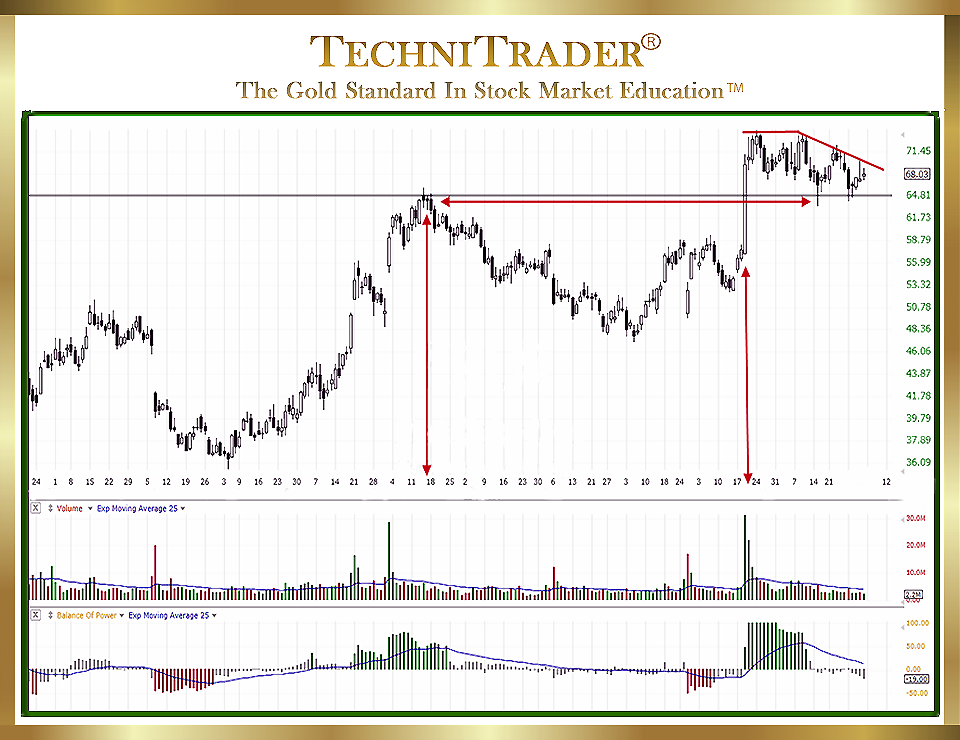
What has happened is that High Frequency Trading buying stock Volume triggered Smaller Fund Volume Weighted Average Price (VWAP) orders. This caused the Balance of Power (BOP) indicator, which tracks large-lot versus small-lot activity, to spike green as seen in the bottom chart window.
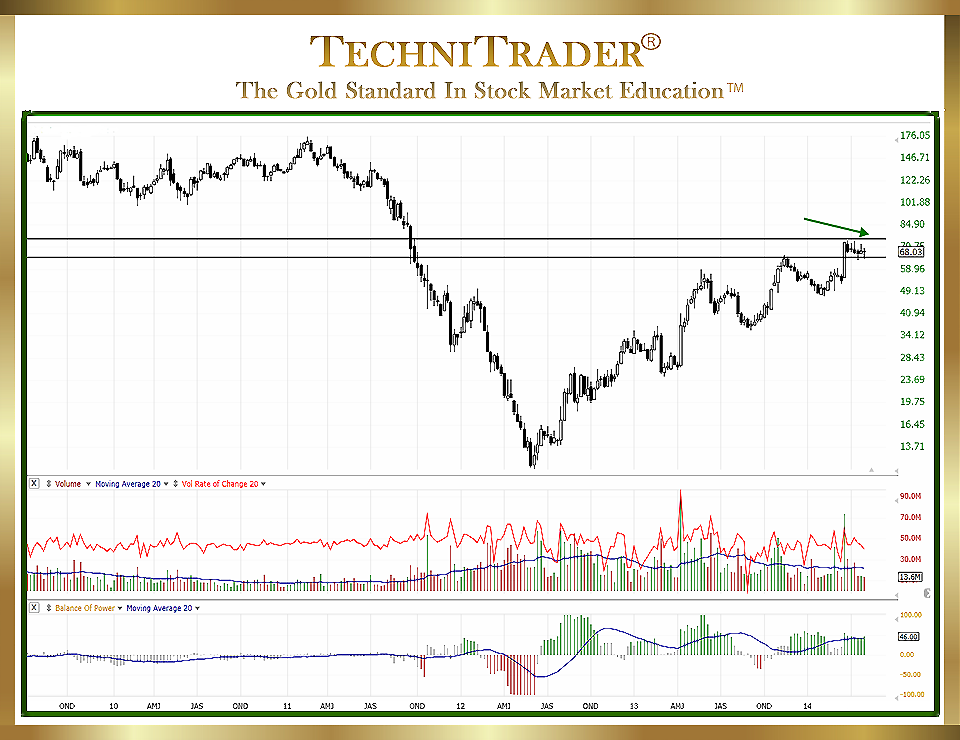
The Weekly Chart View below shows far more information that can help a trader determine which Trading Style to use; for example, whether Swing Trading or Position Trading would be best. Swing Traders and Position Traders use completely different entry signals, support levels, and exit techniques.
Knowing which Trading Style to use for this particular stock makes all the difference in whether the trade will be successful with high profits or if it will have weak profits or a loss.
LEARN MORE at TechniTrader.Courses
Trade Wisely,
Martha Stokes CMT
TechniTrader technical analysis using TC2000 charts, courtesy of Worden Bros.
Chartered Market Technician
Instructor & Developer of TechniTrader Stock & Option Courses
Copyright ©2017–2024 Decisions Unlimited, Inc. dba TechniTrader. All rights reserved.
TechniTrader is also a registered trademark of Decisions Unlimited, Inc.