
Why Use the Detrending Price Oscillator (DPO) Indicator?
To Identify Stock Bottoming Formations Earlier
One of the crucial requirements for Swing and Day Traders is the ability to identify the commencement of a bottom in a stock chart candlestick pattern. This offers two huge advantages to the Technical Trader:
- The ability to avoid Selling Short as the bottom starts, often with huge velocity runs and big rebound action.
- The opportunity to trade the upside velocity that often accompanies a sudden reversal of trend pattern.
In the chart example below, the Detrending Price Oscillator (DPO) indicator formed an extreme trough deviation on extremely high stock Volume with a spike on the Accum/Dist to the bottom of its chart window and an extreme Money Flow Index spike that exceeded the low of its chart window.
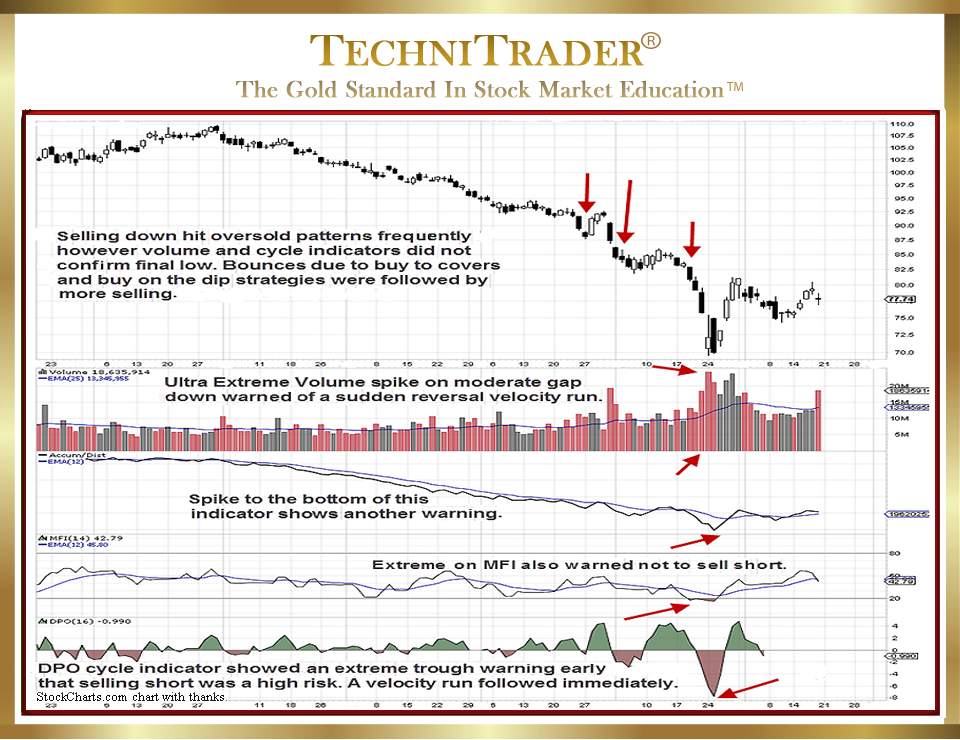
All four indicators are showing that the selling was well beyond the normal ranges of overbought. The stock had overbought price action previously; however, it continued to move down further as the stock Volume Indicators did not confirm an extreme condition. The Detrending Price Oscillator indicator was not extreme, and stock Volume was above-average but not extreme.
The problem for most Technical Traders is how to identify a true bottom low from simply an oversold condition on a continuing downtrend or a Market Correction phase.
LEARN MORE at TechniTrader.Courses
Trade Wisely,
Martha Stokes CMT
TechniTrader technical analysis using a StockCharts chart, courtesy of StockCharts.com
Chartered Market Technician
Instructor & Developer of TechniTrader Stock & Option Courses
Copyright ©2015–2025 Decisions Unlimited, Inc. dba TechniTrader. All rights reserved.
TechniTrader is also a registered trademark of Decisions Unlimited, Inc.