
What Is Advanced Technical Analysis of Candlestick Charts?
List of Tips for Choosing High-Quality Stock Picks
Advanced Technical Analysis of Candlestick Charts for Trading Stocks gives you more opportunities to trade high-quality stock picks that earn more profits per trade. The goal with every trade you make should be higher profits per trade. Taking pennies for profit on a trade will result in lower overall income from trading at the end of the year.
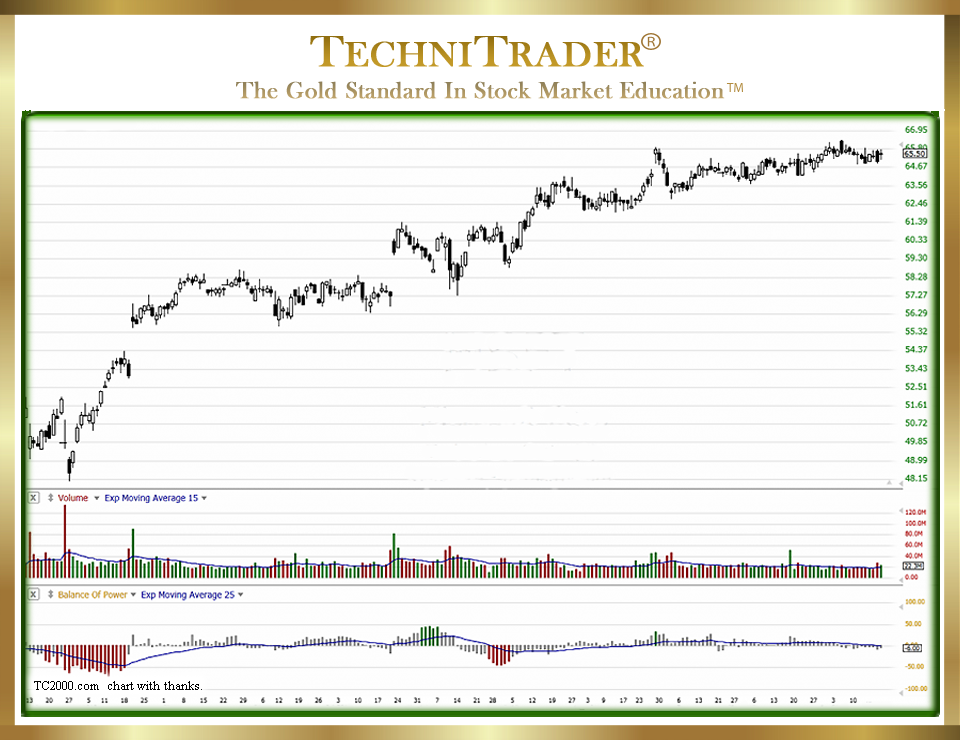
See the candlestick chart example below.
Remember, your time is a cost factor. Trading frequently with small nickel-and-dime profits increases risk, wastes time, and is extra work. Trading high-profit stocks, trading only when the patterns are ideal, and taking whole points per trade will increase your success and income dramatically.
Often, traders focus on finding a reversal or continuation pattern but fail to see the entire picture of what the candlesticks are telling you.
Candlestick Charts for Trading Stocks provide a visual image that is far easier to read and understand than any other charting type.
Hone Your Candlestick Chart Analysis with 10 Simple Techniques:
- Compare the Current Run Gain in points to previous runs on the short-term trend.
- Are there Shrinking Runs, where each run up has smaller candlesticks and less point gain?
LEARN MORE at TechniTrader.Courses
Trade Wisely,
Martha Stokes CMT
TechniTrader technical analysis using a TC2000 chart, courtesy of Worden Bros.
Chartered Market Technician
Instructor & Developer of TechniTrader Stock & Option Courses
Copyright ©2017–2024 Decisions Unlimited, Inc. dba TechniTrader. All rights reserved.
TechniTrader is also a registered trademark of Decisions Unlimited, Inc.