Why Use Balance of Power Hybrid Stock Indicator?
So Powerful It Reveals Dark Pools in the Automated Markets
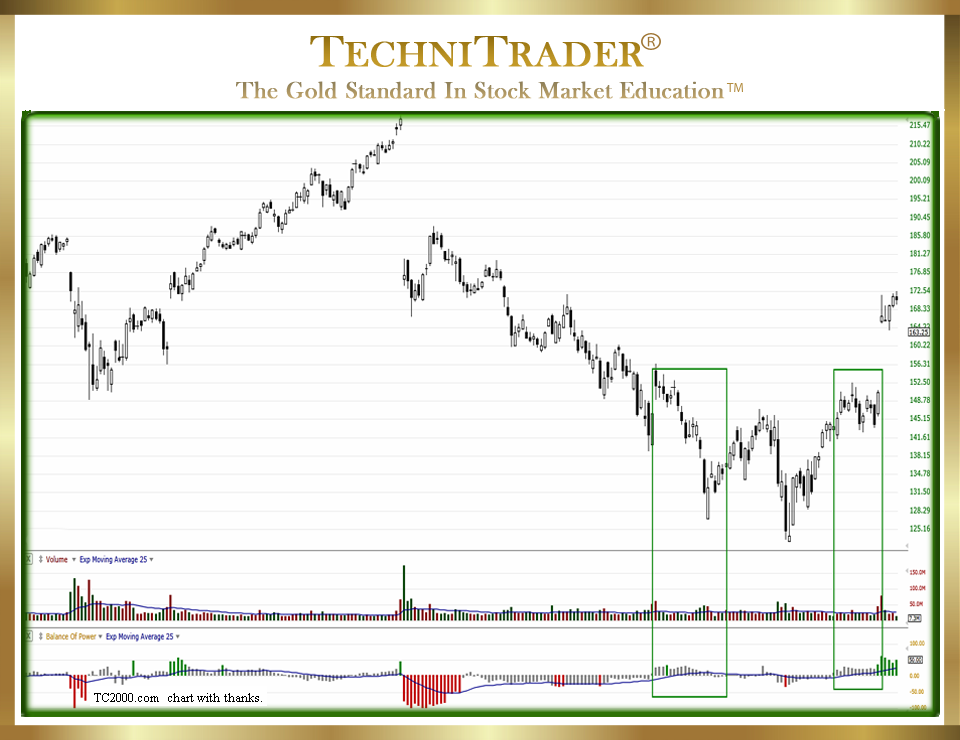
There is one critical factor that separates highly successful traders from those who struggle with mediocre returns. It is the awareness of how new Alternative Trading System (ATS) venues, new order processing, and new algorithms have forever changed how stocks must be analyzed to maximize profit potential in all trades. Today, analyzing stocks using the Balance of Power (BOP) Hybrid Stock Indicator reveals Dark Pools in the automated markets.
See chart example #1 below.

The most popular and prevalent indicators for stock analysis are the Price and Time Indicators. There are over 200 Price and Time Indicators with MACD, Stochastic, Bollinger Bands®, and RSI being some of the more popular ones. By contrast, there are less than a dozen stock Volume and Time Indicators and only a few rare Hybrid Indicators, such as for example the Balance of Power Hybrid Stock Indicator, which contains all three pieces of data including Price, Time, and Quantity aka stock Volume.
Quantity data has the least amount of stock indicators because at the time Technical Analysis was being developed one hundred years ago, Price was the most important indicator for stock analysis and was used by both Fundamentalists and early “chartists” later known as Technical Analysts.
However, nowadays with 80% of all the market order flow fully automated, internalized order activity on the rise, and Dark Pool activity increasing, the Price Indicators are no longer the most important analysis needed for both Fundamentalists and Technical Analysts.
What is far more important are the Hybrid Indicators that combine all three pieces of data into a far superior and more complex algorithm formulation to reveal the size and incremental buy or sell patterns of giant share lots over time as shown in the Balance of Power Hybrid Stock Indicator.
This is due to empirical evidence that consistently proves the largest and most important Stock Market Participant Group, which is the Buy Side Institutions, DOES NOT MOVE PRICE. It used to be that when their large to giant lots started moving through the exchanges, the orders were shown on the limit order books of market makers. At that time, everyone using Day Trading systems could see these transactions moving through the order processing system. This caused a domino effect for Day Traders, Scalpers, Professional Traders, and Floor Traders. They all tried to jump in ahead of the giant-lot orders to take advantage of the surge of stock Volume these orders created. It was not called “front-running” then, but that was exactly like the front-running of High Frequency Traders (HFTs) nowadays. The Buy Side Institutions got rather tired of this and demanded Alternative Trading System venues that would protect their orders from this activity.
LEARN MORE at TechniTrader.Courses
Trade Wisely,
Martha Stokes CMT
TechniTrader technical analysis using TC2000 charts, courtesy of Worden Bros.
Chartered Market Technician
Instructor & Developer of TechniTrader Stock & Option Courses
Copyright ©2017–2024 Decisions Unlimited, Inc. dba TechniTrader. All rights reserved.
TechniTrader is also a registered trademark of Decisions Unlimited, Inc.
