What Is the New Rounding Top Candlestick Pattern?
Use Weekly View to See Formation Easily
The Rounding Top Candlestick Pattern used to be a rare topping pattern; however, in the last few years, this type of top is the most commonly missed Topping Formation. It goes unnoticed until there is a sudden downside run, often on a High Frequency Trader (HFT) stock volume surge with a gap down or huge point run down.
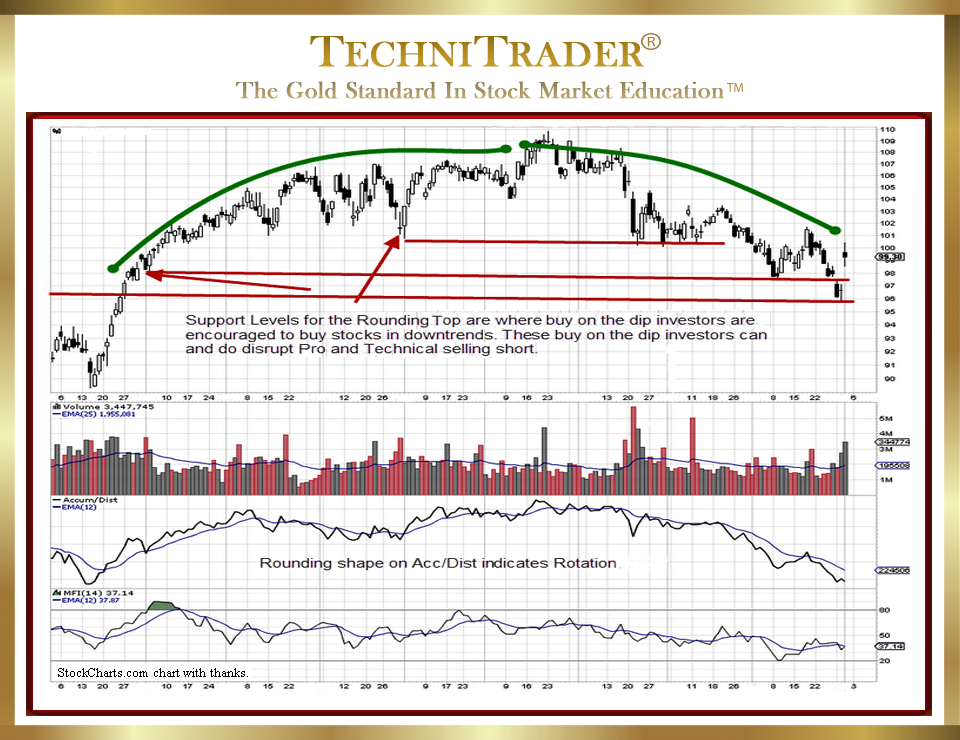
The chart example below developed a Rounding Top Candlestick Pattern as Dark Pools quietly rotated out of this stock.

The stock briefly shifted sideways, and then each time smaller-lot buyers moved in, the rotation selling by the Dark Pools began the bending of the trend. Rather than clearly higher peaks and valleys, the stock was unable to make definitive higher highs and higher lows.
“Buy the Dip” investors are often buying at lows of prior retracements and/or at minor support levels. This is a problem for most Technical Traders who assume the weaker support is not a bounce risk factor.
The bounce areas on a rounding top are often weak support levels, as “Buy the Dip” strategies are based on fundamental support rather than technical support for the stock.
Rounding pattern shapes will also appear on large-lot versus smaller-lot indicators, which are easier to see at times.
LEARN MORE at TechniTrader.Courses
Trade Wisely,
Martha Stokes CMT
TechniTrader technical analysis using a StockCharts chart, courtesy of StockCharts.com
Chartered Market Technician
Instructor & Developer of TechniTrader Stock & Option Courses
Copyright ©2015–2025 Decisions Unlimited, Inc. dba TechniTrader. All rights reserved.
TechniTrader is also a registered trademark of Decisions Unlimited, Inc.
