What Indicators Reveal Dark Pool Quiet Rotation™?
Time Segmented Volume and MoneyStream Reveal Buy Side Institutions
Buy Side Institutions use Dark Pools to hide their giant-lot orders and to ensure that there is no major disruption of the current trend when those orders are triggering. The Securities and Exchange Commission (SEC) has investigated the practices of Buy Side Institutions using Dark Pools, and it has been proven that they are not getting any price advantage.
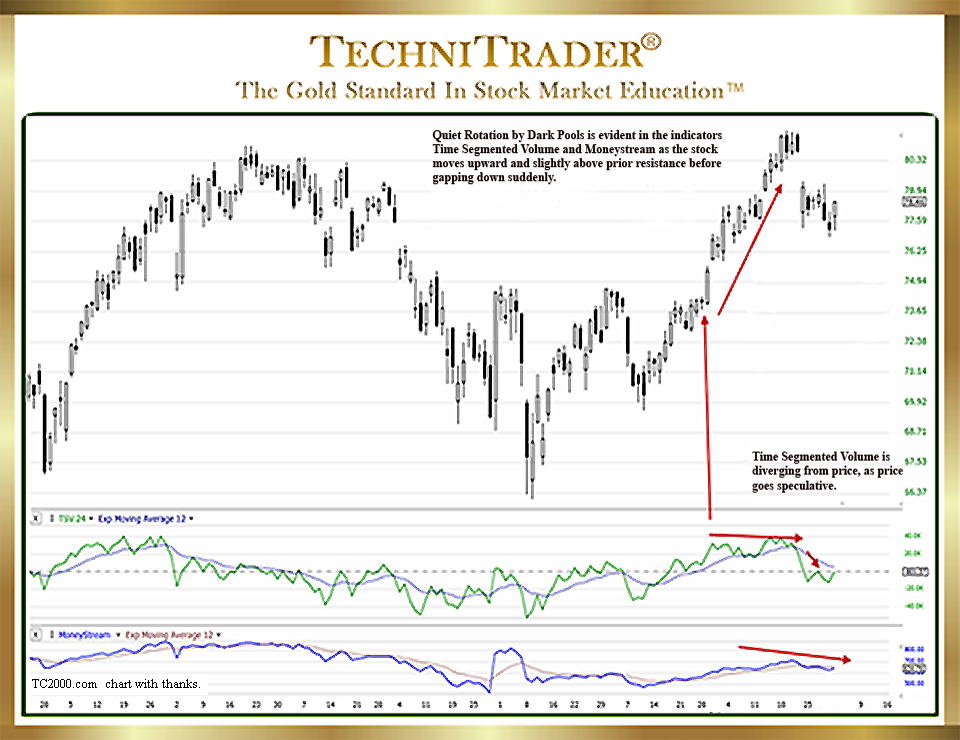
The chart example below has been in Dark Pool Quiet Rotation for some time.

In addition to Balance of Power (BOP), the other TC2000 Chart Indicators that reveal Dark Pool Quiet Rotation are Time Segmented Volume (TSV) and MoneyStream (MS). Time Segmented Volume is a stock Volume Oscillator and is shown in the middle chart window. It clearly reveals a contrarian stock Volume pattern and that stock Volume is heavier now on the sell side than on the buy side.
MoneyStream is in the bottom chart window, and it reveals that the flow of money into this stock is not keeping up with the fast pace of the Retail Traders and the Smaller Funds.
The Buy Side Institutions use these two Stock Market Participant Groups as a cloak to hide their Dark Pool Quiet Rotation patterns. By not disturbing the trend but allowing the stock to climb higher due to Retail Traders’ and Smaller Funds’ buying patterns, the Buy Side Institutions actually benefit as they sell hidden on their Dark Pool Alternative Trading System (ATS) venues.
LEARN MORE at TechniTrader.Courses
Trade Wisely,
Martha Stokes CMT
TechniTrader technical analysis using a TC2000 chart, courtesy of Worden Bros.
Chartered Market Technician
Instructor & Developer of TechniTrader Stock & Option Courses
Copyright ©2017–2025 Decisions Unlimited, Inc. dba TechniTrader. All rights reserved.
TechniTrader is also a registered trademark of Decisions Unlimited, Inc.
