Why Learn to Identify Bollinger Bands® Sideways Candlestick Patterns?
Find Candlestick Platforms Prior to Runs
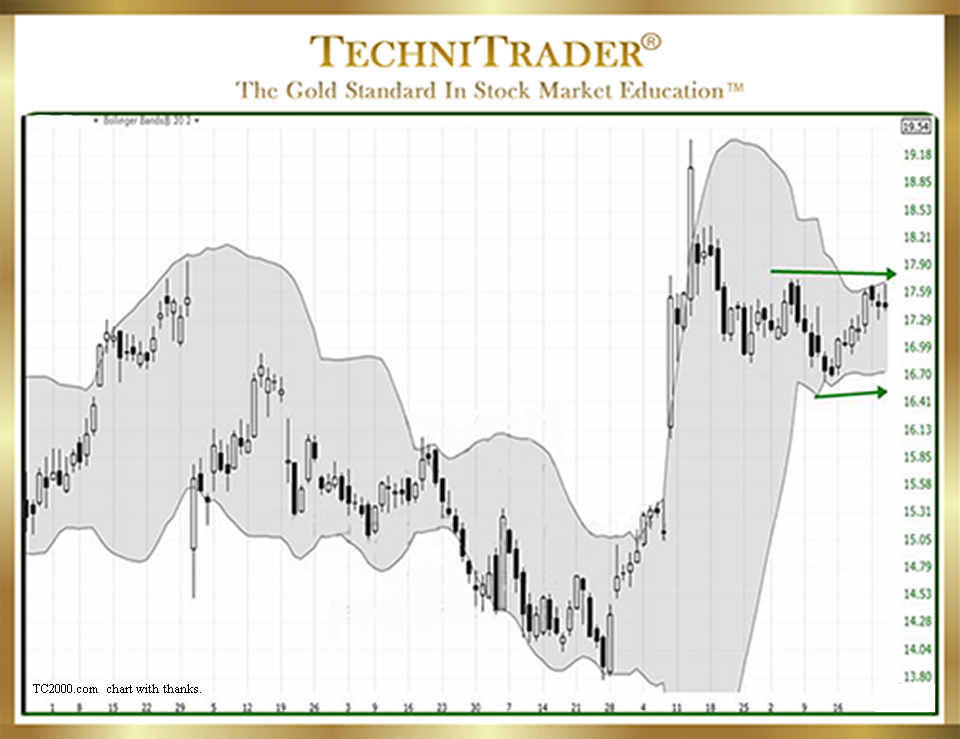
Using Bollinger Bands in TC2000.com Charts makes it far easier to determine if a Candlestick Platform is underway or if it is a wider sideways Trading Range candlestick pattern. Below is an example of a stock that had been in a Trading Range pattern over a few months and then had a High Frequency Trading velocity run.
The current compression shows near-perfect horizontal Bollinger Bands on both the upper and lower bands, indicating that price is compressing inward equally from highs and lows. This is a powerful price Platform Market Condition pattern that is often missed by beginner Individual Investors and Retail Traders.

The equal compression means that there is equilibrium between buyers and sellers at that moment, which tends to favor the upside after a High Frequency Trader-driven velocity run. Dark Pool Quiet Accumulation is underway with Buy Side Institutions using Alternative Trading Systems (ATSs), their buying going on unnoticed for the moment. Dark Pools control price to create this Platform Market Condition candlestick pattern on stock charts. Since the first velocity run was triggered by High Frequency Traders (HFTs), the next move up is likely to also be an HFT gain day.
LEARN MORE at TechniTrader.Courses
Trade Wisely,
Martha Stokes CMT
TechniTrader technical analysis using TC2000 charts, courtesy of Worden Bros.
Chartered Market Technician
Instructor & Developer of TechniTrader Stock & Option Courses
Copyright ©2017–2025 Decisions Unlimited, Inc. dba TechniTrader. All rights reserved.
TechniTrader is also a registered trademark of Decisions Unlimited, Inc.
