Elliott Wave Trading Strategies
How to Understand the Wave Cycles for Entries and Exits
The foundation of the Elliott Wave Theory is from the Charles Dow Theory that the market moves in waves and cycles. These cycles have been altered in recent years due to the massive internal structural changes of the Stock Market Participant Cycle. This cycle is dominant and is important for all Elliott Wave Traders to learn so that you can recognize which Stock Market Participant Group has created the current wave or wave pattern and also whether this will alter the Elliott Wave Cycle or lengthen or shorten it and how to use this knowledge in your Trading Strategies.
The Stock Market Participant Cycle is a far more complex cycle than when Charles Dow first wrote his theory of the three-wave pattern. It is more complicated and intricate than the original Elliott Wave Theory and the adapted and extended theories written by Frost and Prechter in the 1970s–1980s.
The Stock Market Participant Cycle is the theory taught by TechniTrader® which was developed and written by Martha Stokes CMT. This theory fills the gap in the Elliott Wave Cycle theory that has occurred due to new Stock Market Participant Groups and technological changes to the internal hidden Market Structure aka the professional side of the market. The retail crowd has scant information about what actually goes on within the internal Market Structure where no Retail Trader is allowed.
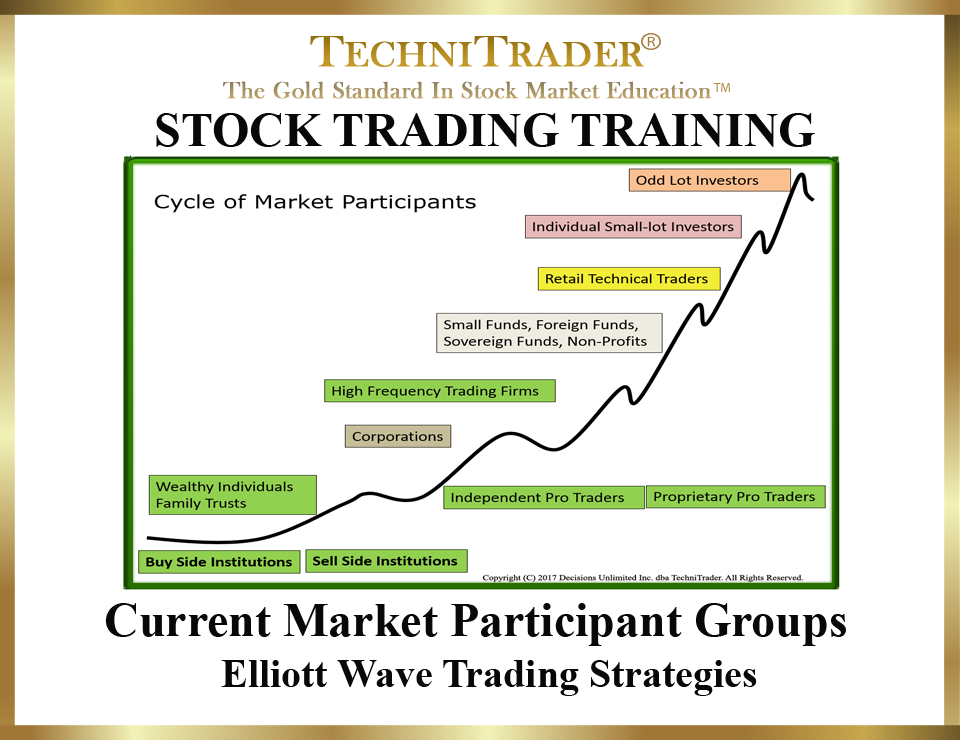
When you view the Stock Market Participant Cycle chart below, the first thing to notice is that there are now 9 cycles instead of just 5, which can throw off the analysis if not recognized. Oftentimes, not accepting that the wave pattern is not just 3, 5, or even 7, but 9 waves can confuse and alter the proper analysis of the wave pattern.
In addition, nowadays with the dominance of the Dark Pools and High Frequency Traders (HFTs), it has become imperative that Elliott Wave Traders identify WHICH Stock Market Participant Group is controlling price within that wave or wave pattern. When you know which group controls price, you will know immediately how price will behave in the near term, what indicators will reveal Dark Pool activity, and how to trade that wave pattern for optimal profits.
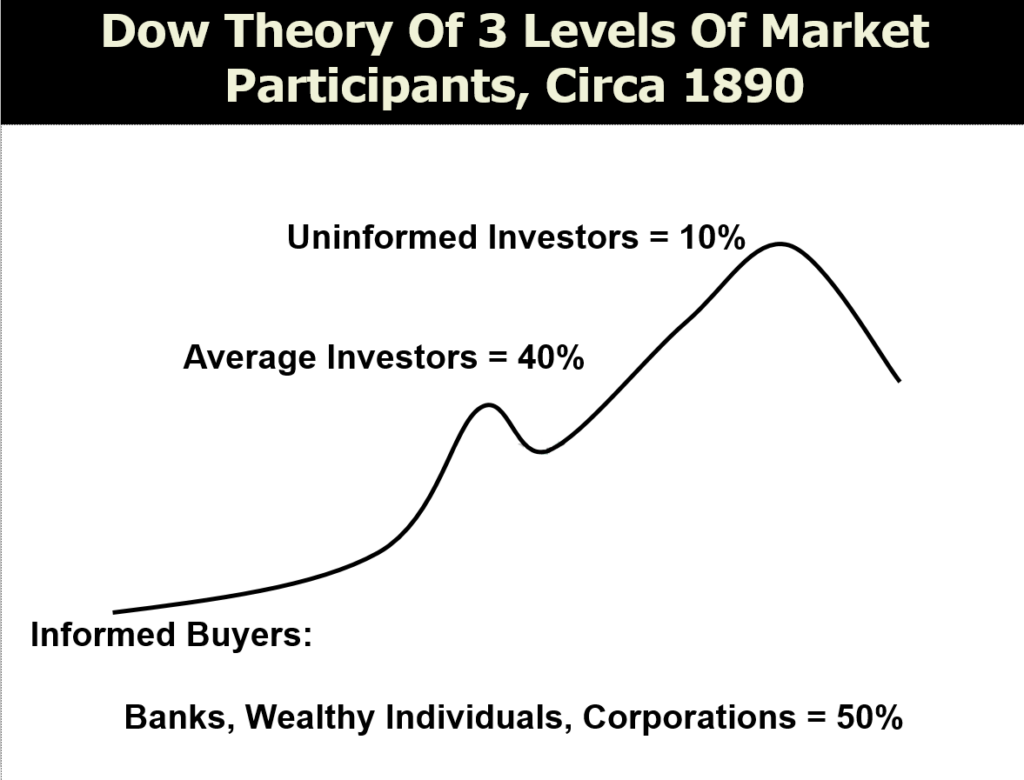
The Stock Market Participant Cycle of Dow’s and Elliott’s day was a much simpler cycle. The chart example below shows that original cycle wave pattern created by Dow and interpreted by Elliott to include the Fibonacci theory as part of his Wave Theory.

This cycle has expanded, especially in the past 2 decades, due to the structural changes in the financial markets. Every market has its own unique Stock Market Participant Cycle. The chart below shows the current cycle for the Stock Market.

LEARN MORE at TechniTrader.Courses
Trade Wisely,
Martha Stokes CMT
TechniTrader technical analysis using a TC2000 chart, courtesy of Worden Bros.
Chartered Market Technician
Instructor & Developer of TechniTrader Stock & Option Courses
Copyright ©2017–2025 Decisions Unlimited, Inc. dba TechniTrader. All rights reserved.
TechniTrader is also a registered trademark of Decisions Unlimited, Inc.
