How to Analyze Stock Support and Resistance
Comparing Price Action with Leading Indicators
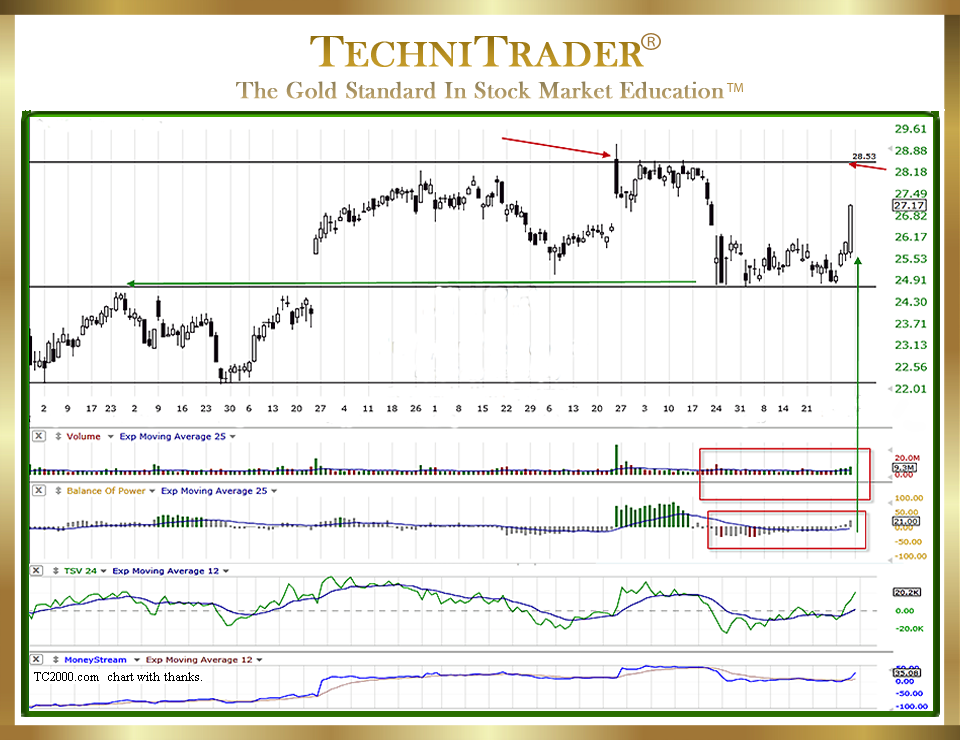
During a downtrend, traders need to be able to determine if a big white candlestick is a true Reversal back to an uptrending pattern or if it is just momentary Rebound price action caused by Buy the Dip Investors and Buy to Cover Traders. Below is a stock chart example that requires more than just a candlestick or an indicator crossover to analyze properly.

Buy the Dip Investors can and do move price often in big one-day gains which then reverse and whipsaw the following trading day. Buy to Cover price action moves for Sell Short Traders are usually smaller and more controlled Exit Candlestick Patterns that clearly do not reverse the downtrend back to an uptrend.
Learning to properly interpret Charts, Price, and stock Volume is a skill that all Retail and Technical Traders need to spend time developing. If a trader only relies upon indicator crossovers, a handful of Candlestick Patterns, or a combination of both, they will encounter continual whipsaws and losing trades.
Sure, there will be that occasional stock that moves up for a nice gain. It makes the trader feel happy and confident until the next loss occurs. It is easy to make stock trading profits, but it is harder to keep them.
Developing Spatial Pattern Recognition Skills™ is crucial to consistently successful trading and a high Return on Investment (ROI) by the end of the year.
Making an income from trading demands more than a meager 2% gain on a trade. Keep in mind that many trading costs far exceed a 2% gain. Oftentimes, traders are losing money with such low returns and don’t even realize it until the end of the year.
How to Analyze Stock Support and Resistance requires studying the following:
- Does stock Volume lead price, or does it lag price?
- Are the giant Buy Side Institutions which use Dark Pools quietly accumulating the stock?
- Is the candlestick a normal size, or is it extraordinarily long? What does the Candlestick Pattern represent?
LEARN MORE at TechniTrader.Courses
Trade Wisely,
Martha Stokes CMT
TechniTrader technical analysis using a TC2000 chart, courtesy of Worden Bros.
Chartered Market Technician
Instructor & Developer of TechniTrader Stock & Option Courses
Copyright ©2015–2025 Decisions Unlimited, Inc. dba TechniTrader. All rights reserved.
TechniTrader is also a registered trademark of Decisions Unlimited, Inc.
