Why Use Contrarian Patterns for Stock Top Warning?
Indicators Reveal Giant Institutions Rotating Out as Price Moves Up
Often for Beginners, the market reversing and heading down into a correction is a complete surprise or shock. They are not expecting the turn, nor are they prepared for it. Fortunately for Retail Traders, there are plenty of indicators that can warn of a top before it actually occurs. These can be Contrarian Patterns. A Contrarian Pattern is simply something that is moving in opposition to price.
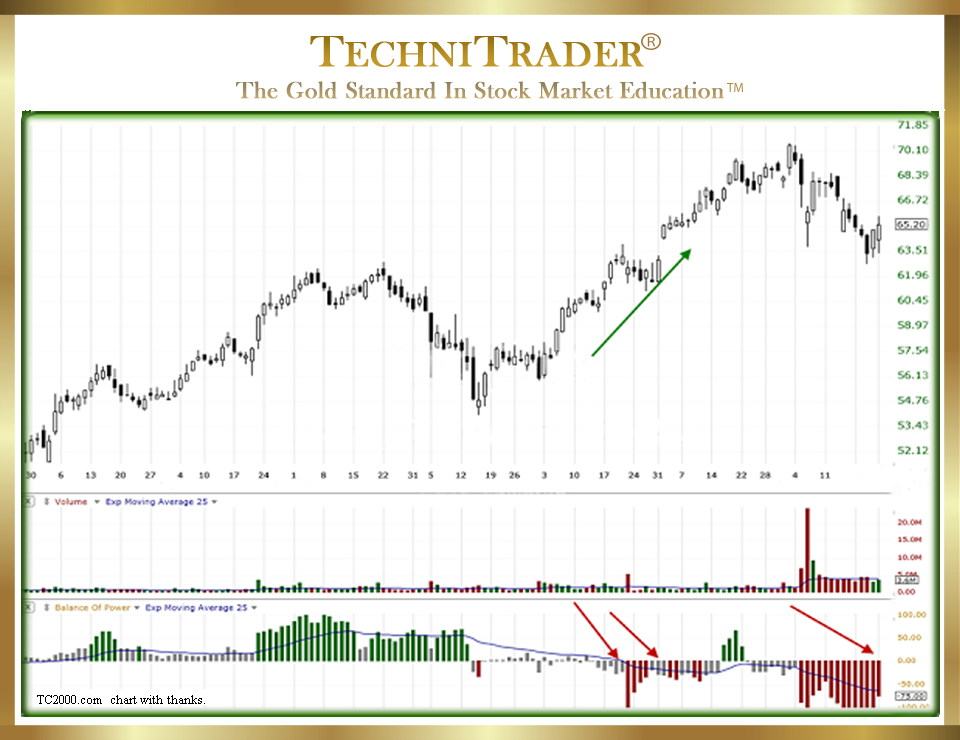
See the candlestick chart example below.

In other words, the indicator is exposing selling while price is still moving up. This is one of the key elements to avoiding getting into a stock and then having it reverse on you and sell down as you take a loss. In the candlestick chart example above, the Balance of Power (BOP) indicator in the bottom chart window exposes whether large-lot giant Buy Side Institutions are buying or selling.
It is showing red bars, which means these Giant Funds are selling or rotating out of this stock, but price still climbs upward.
Many Retail Traders wonder how this can be. If giant Buy Side Institutions are selling or in Dark Pool Quiet Rotation™ out of a stock, how can price continue upward?
What drives price upward is demand AND types of orders. If smaller lots are buying “At Market”, which is the most common way for a new investor to buy a stock, then price will continue higher as long as the giant Buy Side Institutions are careful about not selling too many large-lot shares all at once.
LEARN MORE at TechniTrader.Courses
Trade Wisely,
Martha Stokes CMT
TechniTrader technical analysis using a TC2000 chart, courtesy of Worden Bros.
Chartered Market Technician
Instructor & Developer of TechniTrader Stock & Option Courses
Copyright ©2017–2025 Decisions Unlimited, Inc. dba TechniTrader. All rights reserved.
TechniTrader is also a registered trademark of Decisions Unlimited, Inc.
