How to Determine a Downtrend Is Reversing
Use Leading Indicators to Identify Confirmation
Technical Traders and Retail Traders need to be able to identify Reversal Candlestick Patterns during a Downtrend in order to avoid huge losses on Selling Short Trades and to be prepared and ready for early entry in the reversal of the trend. When a Downtrend concludes with a V candlestick exhaustion pattern, the extreme selling suddenly reverses. This is because stocks drop into Buy Side Institution Dark Pool Buy Zones™ where Time Weighted Average Price (TWAP) orders trigger automatically reversing the trend suddenly, even midday.
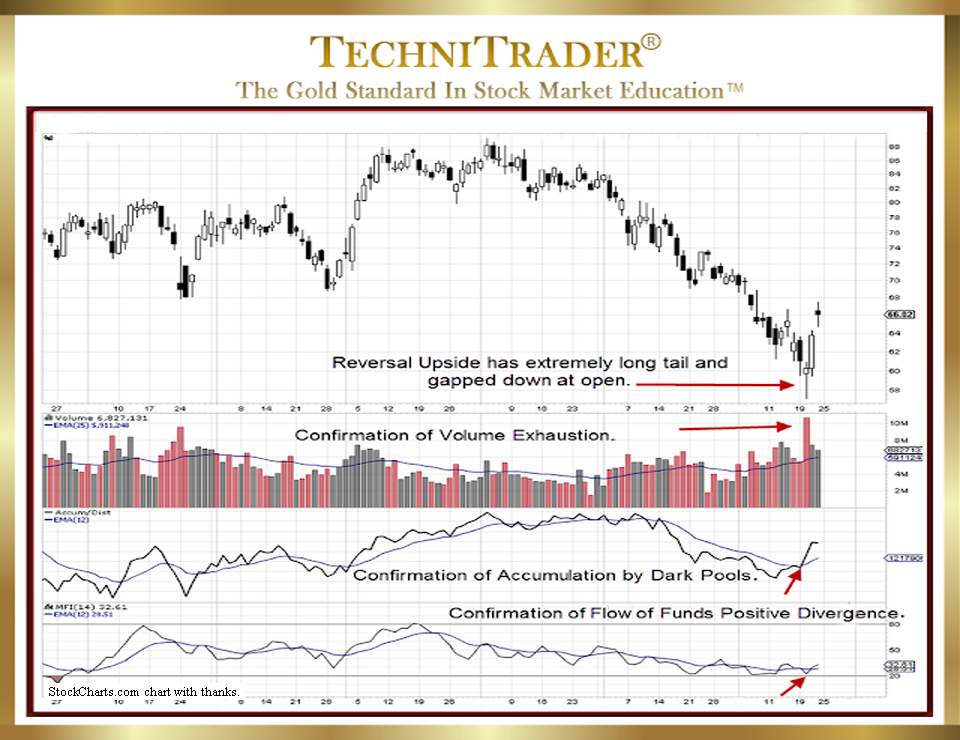
The chart example below had a strong reversal candlestick and an indicator confirmation pattern. It has moved approximately 5 points since the reversal pattern formed.

In this chart example, the candlestick as indicated by the red arrow on price is a Reversal Upside entry signal, which requires:
- The tail or “lower shadow” must be 3 times the length of the body of the candlestick.
- A gap down on the day that the Reversal Upside formed.
- Confirming indicators which show that this is a true reversal and not a Bounce or a Buy to Cover.
Confirming indicators for this chart example are the following, with red arrows in the 3 indicator chart windows showing the confirmation:
- A stock Volume Exhaustion Pattern to the downside, which is the red bar spiking to the top of the stock Volume indicator chart window.
- A crossover of the Accum/Dist indicator in the middle chart window.
- The Money Flow Index (MFI) indicator in the bottom chart window with a Positive Divergence.
LEARN MORE at TechniTrader.Courses
Trade Wisely,
Martha Stokes CMT
TechniTrader technical analysis using a StockCharts chart, courtesy of StockCharts.com
Chartered Market Technician
Instructor & Developer of TechniTrader Stock & Option Courses
Copyright ©2017–2025 Decisions Unlimited, Inc. dba TechniTrader. All rights reserved.
TechniTrader is also a registered trademark of Decisions Unlimited, Inc.
