Why Are Favorite Technical Chart Patterns No Longer Reliable?
Market Structure Has New Stock Order Types & Venues
Many traders are complaining that their favorite Technical Candlestick Patterns no longer work or that they work some of the time but fail more often than not. Technical Traders who have relied upon Technical Analysis patterns that were identified, named, and written about starting in the 1970s are finding that these once very consistent patterns are now questionable.
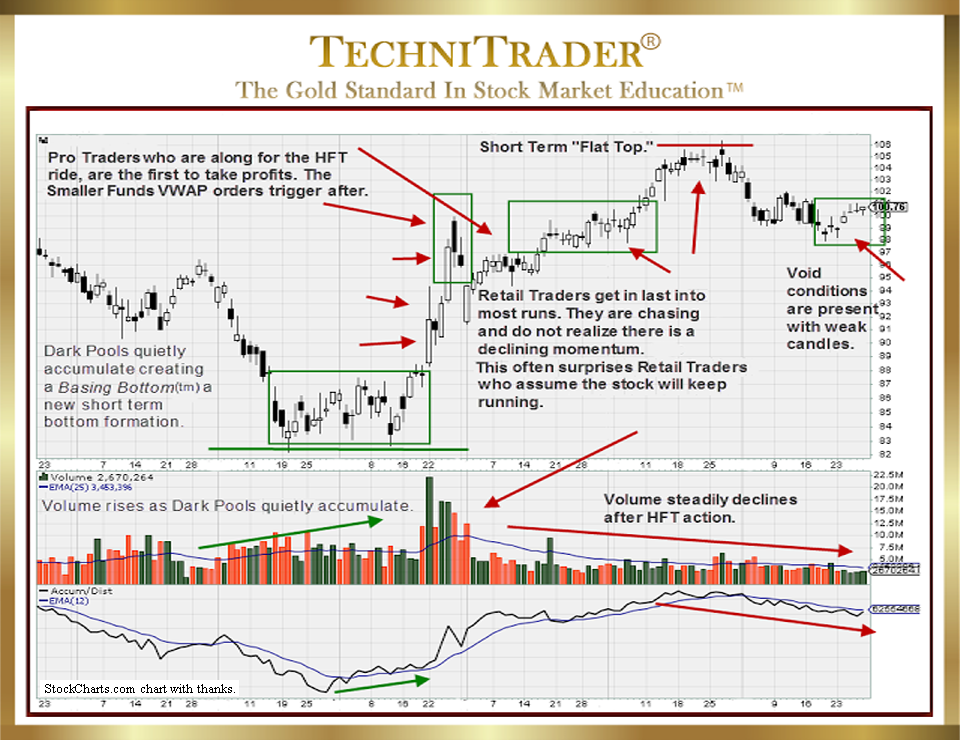
See the chart example below.

Is Technical Analysis broken as many traders claim? Can Technical Analysis still be used, or should you just go back to guessing or abandon stock trading for some other riskier trading instrument?
No, it is not broken; in fact, it is stronger than ever. What is broken is the fact that Technical and Retail Trader training for Technical Analysis has not kept up with the changing Market Structure.
Why favorite Technical Chart Patterns are no longer reliable is due to changes including new stock order types, new venues, giant Buy Side Institutions using Dark Pools in Alternative Trading Systems (ATSs), High Frequency Traders (HFTs) with millisecond trading capabilities, the Retail Broker Oligopoly, Professional Traders’ First of Day (FOD) – End of Day (EOD) orders, and many more.
LEARN MORE at TechniTrader.Courses
Trade Wisely,
Martha Stokes CMT
TechniTrader technical analysis using a StockCharts chart, courtesy of StockCharts.com
Chartered Market Technician
Instructor & Developer of TechniTrader Stock & Option Courses
Copyright ©2017–2025 Decisions Unlimited, Inc. dba TechniTrader. All rights reserved.
TechniTrader is also a registered trademark of Decisions Unlimited, Inc.
