Why Use Balance of Power to Reveal Dark Pool Quiet Rotation™ & Distribution?
Find Earlier Sell Short Entry Signals in Topping Stocks
Balance of Power (BOP) Selling Short indicator patterns are often misread by TC2000 Users. This is because of the different Stock Market Participant Groups who dominate during a downtrending market. Instead of all 9 Stock Market Participant Groups as there is during an uptrend, the downtrend has only 3 groups that actually Sell Short regularly. It is not those who are Selling Short that cause the stock to top. It is the Buy Side Institutions who are using a Dark Pool Quiet Rotation selling mode to lower their inventory of that stock, or it is Dark Pool Quiet Distribution where they are actually selling the stock in order to place the money into another trading instrument.

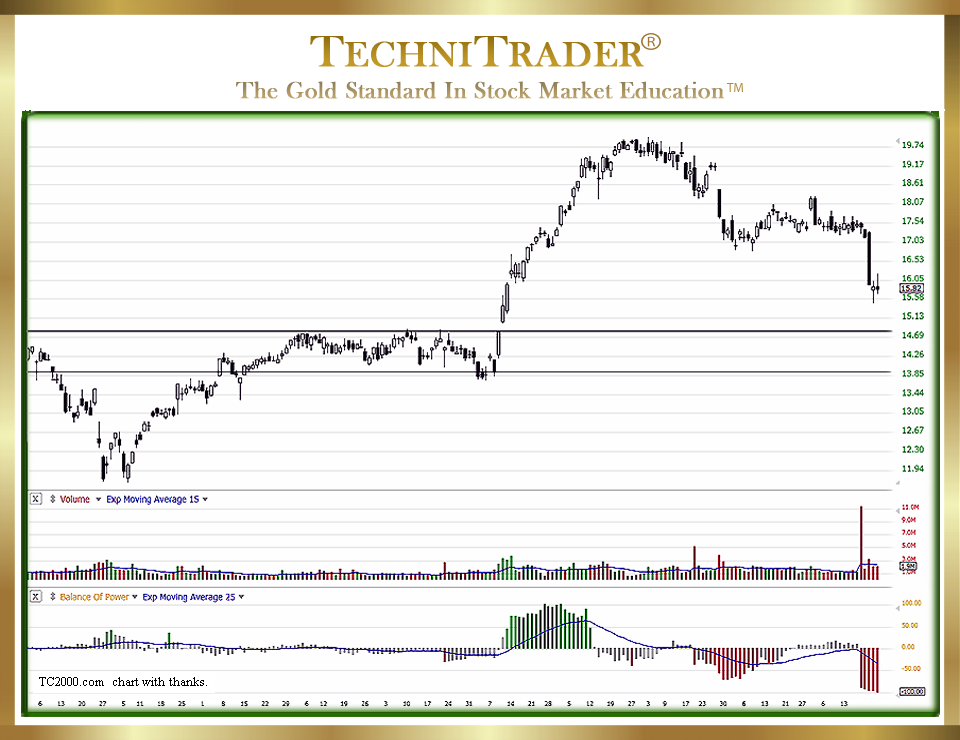
The stock chart above is an excellent example of how Balance of Power reveals the Dark Pool Quiet Rotation going on that initiates the stall of the price action. The Topping Candlestick Formation started out as a sideways candlestick pattern that rounded. As more and more Dark Pool Quiet Rotation and selling occurred, the stock trend slowly succumbed to the large-lot selling mode as fewer smaller lots bought the stock. The Shift of Sentiment™ to the downside is obvious in the Balance of Power indicator.
This is one of the newer Topping Formations. These are due to the controlled and bracketed orders, variety of venues, and routing systems that provide excellent coverage for the large-lot activity from the predatory systems of the High Frequency Traders (HFTs) on the exchanges. Dark Pool Quiet Rotation is evident in Balance of Power, which is an early signal to Swing and Day Traders that this stock has more selling pressure than price is indicating. The slow and steady selling of large lots erodes the price trend over time as smaller lots attempt to Swing Trade or Day Trade this topping action, unaware of the fact that Dark Pool Quiet Rotation is underway.
LEARN MORE at TechniTrader.Courses
Trade Wisely,
Martha Stokes CMT
TechniTrader technical analysis using a TC2000 chart, courtesy of Worden Bros.
Chartered Market Technician
Instructor & Developer of TechniTrader Stock & Option Courses
Copyright ©2017–2025 Decisions Unlimited, Inc. dba TechniTrader. All rights reserved.
TechniTrader is also a registered trademark of Decisions Unlimited, Inc.
