
What Is the Power in Platform Candlestick Patterns?
Buy Side Institutions Buying in Dark Pools Prior to Runs
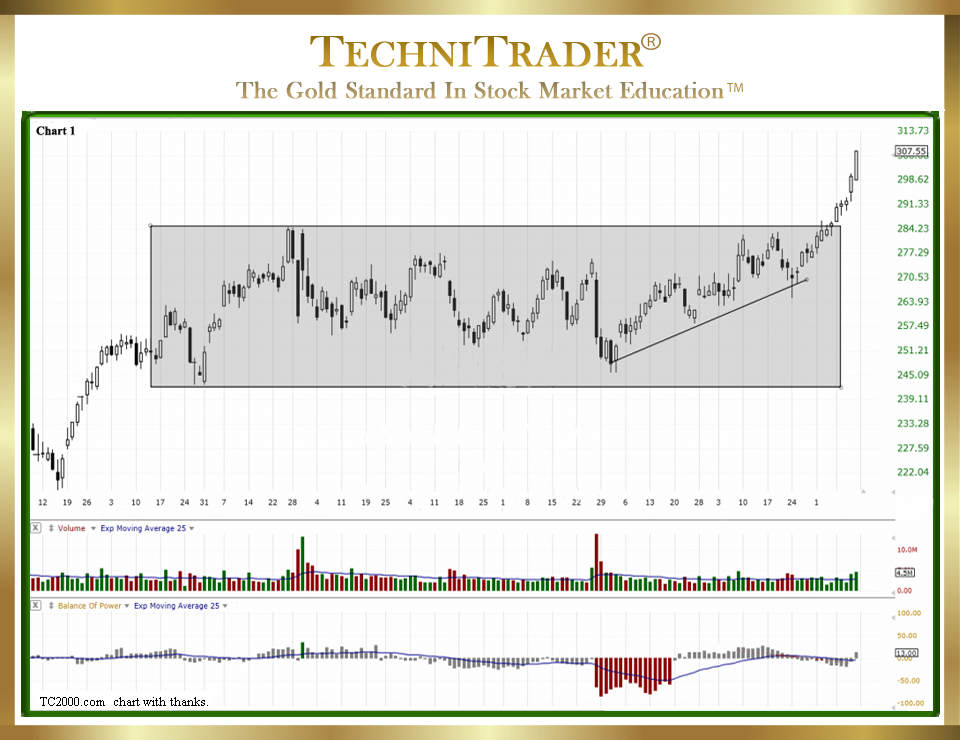
The “Platform Candlestick Pattern” is a relatively new sideways candlestick pattern that is becoming more and more prevalent as the Dark Pools’ activity increases. Dark Pools are Alternative Trading System (ATS) venues that transact giant-lot orders off of the Exchanges. This is legal and actually benefits Mutual Fund Investors and Pension Fund owners. The Platform is always a range, but unlike a true Trading Range, the Platform Candlestick Pattern tends to have much more consistency to its highs and lows. See candlestick chart example #1 below.
LEARN MORE at TechniTrader.Courses
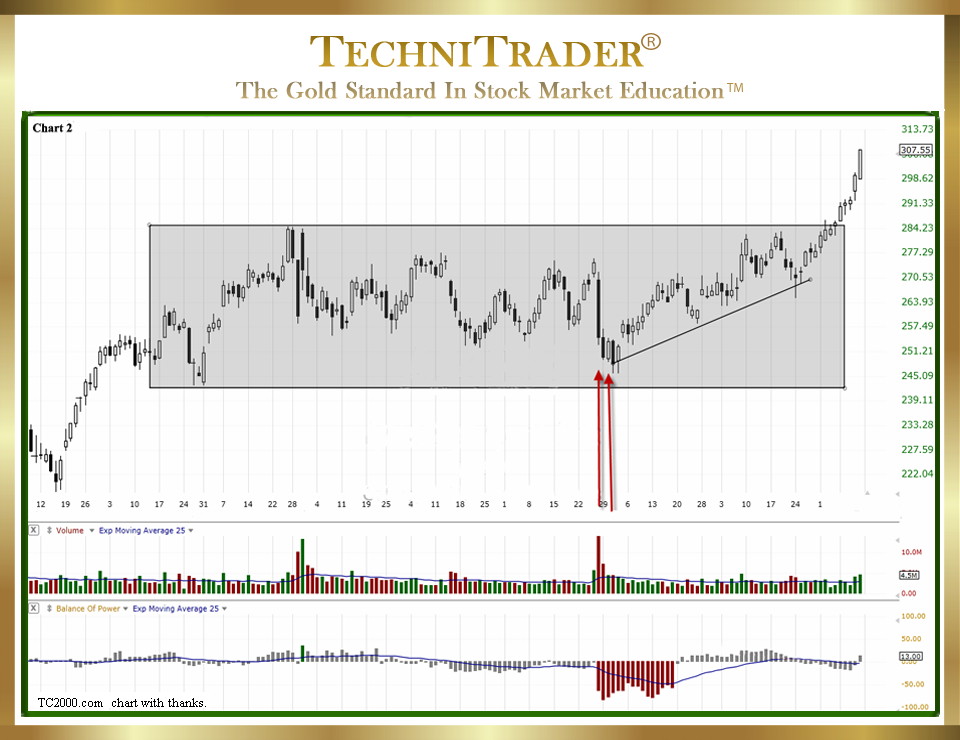
This high and low price range is seldom disrupted, but it can be mostly by High Frequency Traders (HFTs) who do not recognize the footprint of their most sought-after Stock Market Participant Group. In not recognizing the footprint of the giant-lot institutions who are mostly Buy Side Institutions, the High Frequency Traders trigger a brief sell-off. See the two red arrows in candlestick chart example #2 below.
LEARN MORE at TechniTrader.Courses
The attempt is quickly overwhelmed, as the giant Buy Side Institutions using Dark Pools have orders that trigger off the exchanges when price drops to the low of their price range. As the giant institutions buy, their dominance moves price up within the range. Eventually, Professional Traders, Smaller Funds, and sometimes High Frequency Traders will drive price up beyond the Dark Pools’ original high price for their buying.
The Platform Candlestick Pattern develops on stock charts because giant-lot Buy Side Institutions and sometimes giant-lot Sell Side Institutions decide they want to purchase stock of a company. Let’s say that they wish to purchase 50 million shares. They can’t buy all the shares at once, as that would cause the stock to spike in price due to a sudden demand, and perhaps not enough shares being sold would further aggravate shortages of the stock to push price higher. So, they use Dark Pools with a bracketed order system.
These are automated, and a computer triggers the purchases of 100,000–500,000 shares as long as the stock stays within their price range. If the price moves higher than the range specified, then the “Dark Pool Quiet Accumulation” as this is called ceases as the computer program will not trigger.
They determine the bracketed price range for a stock based on Fundamentals. Most Buy Side Institutions and Sell Side Institutions do not use Technical Analysis for buying or selling. Once the price range is determined, their orders are set into an automated computer-generated order system. If the stock falls below their bracketed price range, the computer stops buying the stock. So, this creates a very precise high and low price range called the “Platform Candlestick Pattern”.
Summary
Whenever you see a Platform with very consistent highs and lows with lower stock Volume, this is usually Dark Pool activity, especially if the stock is in a long-term bottom. As price moves up because other traders and Market Participants decide to buy the stock, you will see a compression of price. In candlestick chart example #2 above, the compression occurs on the low price as indicated by the red arrows, see price after that is closing higher and higher before the breakout. This is an ideal pattern for Position Trading because these traders are able to hold a stock for several weeks or months. It is also a useful candlestick pattern for Swing Trading and Momentum Trading IF traders learn how to use Accumulation/Distribution and large-lot tracking indicators.
LEARN MORE at TechniTrader.Courses
If you have not yet begun to trade or invest, go to Introduction: Learn How to Trade Stocks – Free Video Lesson to get started.
Learn the steps to trade like a pro with this introductory mini course. You will learn what it takes to create a Professional Trading Plan that can help you achieve your trading goals: How to Create a Professional Trading Plan
Trade Wisely,
Martha Stokes CMT
TechniTrader technical analysis using TC2000 charts, courtesy of Worden Bros.
Chartered Market Technician
Instructor & Developer of TechniTrader Stock & Option Courses
Copyright ©2017–2024 Decisions Unlimited, Inc. dba TechniTrader. All rights reserved.
TechniTrader is also a registered trademark of Decisions Unlimited, Inc.