Why Track Dark Pools with TC2000 Balance of Power Indicator?
For Swing Trading Momentum Runs Out of Bottoms
You can learn to identify setups for Swing Trading momentum runs by focusing on price trends and indicators that reveal Dark Pool Quiet Accumulation. TC2000 Users have a huge advantage over other Retail Traders. They have access to custom indicators designed specifically to track and reveal Dark Pool Quiet Accumulation and Professional Trader activity, which results in sudden momentum runs created by High Frequency Trading.
LEARN MORE at TechniTrader.Courses

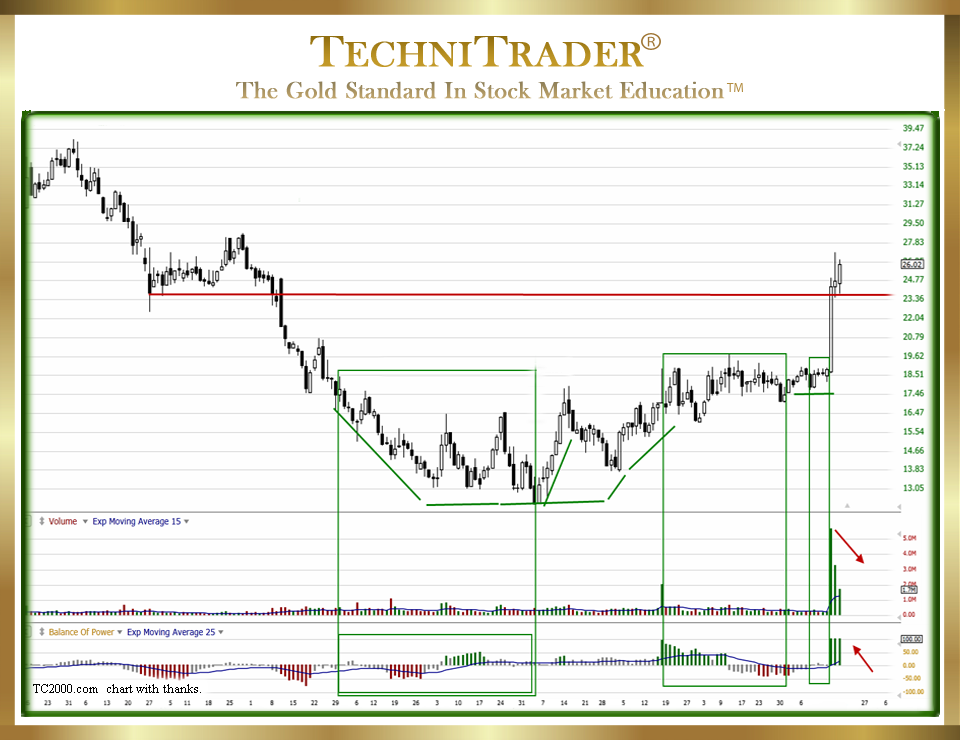
Above is a candlestick chart example of a Small Cap Stock with 37 million outstanding shares. The smaller the number of the outstanding shares, the more likely a liquidity draw by Dark Pools will trigger huge runs and gaps. Therefore, identifying the Dark Pool Quiet Accumulation is a key element to getting into the stock ahead of the High Frequency Trader (HFT) runs.
Worden’s Balance of Power (BOP) indicator reveals the Quiet Accumulation mode by Dark Pools early in this bottoming formation. This is a crucial aspect of entering the stock ahead of the inevitable momentum run or one-day High Frequency Trader gain or gap.
Momentum Trading can be more fun and less work when you employ the Balance of Power indicator written by Don Worden.
This indicator has become better at revealing Dark Pool Quiet Accumulation as the popularity of Alternative Trading Systems (ATSs) continues to increase. More and more Buy Side Institutions, including some Smaller Funds, are using Dark Pool venues more than ever before.
Also, the 5-cent spread for Small Caps is creating plenty of momentum activity for Small Cap stock trading.
LEARN MORE at TechniTrader.Courses
The Securities and Exchange Commission (SEC) conducted a Test Pilot Program for a minimum 5-cent spread on a group of Small Cap Stocks to see if that would create higher liquidity for Small Cap Traders. The Pilot Program proved that wider spreads for Small Cap Stocks worked.
Now, Retail Traders can enjoy the higher profitability of the wider spread on Small Cap Stocks, providing them with far more opportunities for Momentum Trading runs using Swing Trading techniques. The key is identifying the Dark Pool Quiet Accumulation patterns before the breakout occurs.
Relational Technical Analysis™ must be employed to fully understand what Balance of Power is revealing. Technical Analysis is the study of the stock’s trend, candlesticks, and some indicators. Relational Technical Analysis combines all of these with an understanding of how each Stock Market Participant Group buys and sells stocks. In this case, it is where the Dark Pools buy and sell stocks, why they buy, and when they buy.
In the candlestick chart example above, the Balance of Power indicator shows the Shift of Sentiment™ and Dark Pool Quiet Accumulation after the deep correction that started shortly after this stock had its Initial Public Offering (IPO). The footprint is obvious if you know what to look for. Within the bottom, there are also a few Professional Trader runs. As the bottom rounds upward, the Dark Pool Quiet Accumulation mode moves to a higher price range and compresses. This is the signal that this short-term bottom is about to complete. High Frequency Trader action then completes the bottom.
Retail Technical Traders using TC2000 and the Balance of Power indicator can see the setup prior to the breakout by understanding the Balance of Power signal and trigger points. This allows them to use Swing Trading to enter trades prior to the often large HFT runs.
Summary
The size of the Balance of Power indicator bars, the relationship to price action and its overall trend, and the gray-green-red patterns all factor into the analysis. The Balance of Power indicator is NOT just red bars are Dark Pool Quiet Distribution and green bars are Dark Pool Quiet Accumulation. It is far more sophisticated than that nowadays.
As an example, long green bars are NOT Dark Pools. Learning to use Balance of Power properly will enable you to take advantage of this powerful indicator to increase your Momentum Trading profitability by cutting down on your analysis workload and letting you see in advance that a stock is poised for a momentum run.
Most Retail Traders chase the High Frequency Traders who spike Price and stock Volume. However, this leads to a small loss more often than not. Learn how to enter BEFORE High Frequency Trader runs and gaps. Using Balance of Power and interpreting its patterns correctly will help you enter ahead of the High Frequency Traders. This lets you actually front-run the High Frequency Traders.
LEARN MORE at TechniTrader.Courses
If you have not yet begun to trade or invest, go to Introduction: Learn How to Trade Stocks – Free Video Lesson to get started.
Learn the steps to trade like a pro with this introductory mini course. You will learn what it takes to create a Professional Trading Plan that can help you achieve your trading goals: How to Create a Professional Trading Plan
Trade Wisely,
Martha Stokes CMT
TechniTrader technical analysis using a TC2000 chart, courtesy of Worden Bros.
Chartered Market Technician
Instructor & Developer of TechniTrader Stock & Option Courses
Copyright ©2017–2024 Decisions Unlimited, Inc. dba TechniTrader. All rights reserved.
TechniTrader is also a registered trademark of Decisions Unlimited, Inc.
