Why Identify Dark Pool Footprints for Momentum Trades?
Find Great Swing Trading Picks for High Profits
“Dark Pools” is a term used to describe the largest Buy Side Institutions who control vast quantities of long-term investment money. Their Alternative Trading System (ATS) venues are off the exchanges. They are hidden from the Retail Trader who trades via a broker or an Electronic Communication Network (ECN), and their activity is often delayed until after the market closes. This is a huge part of the market with over 40 Alternative Trading Systems available to the Dark Pools.
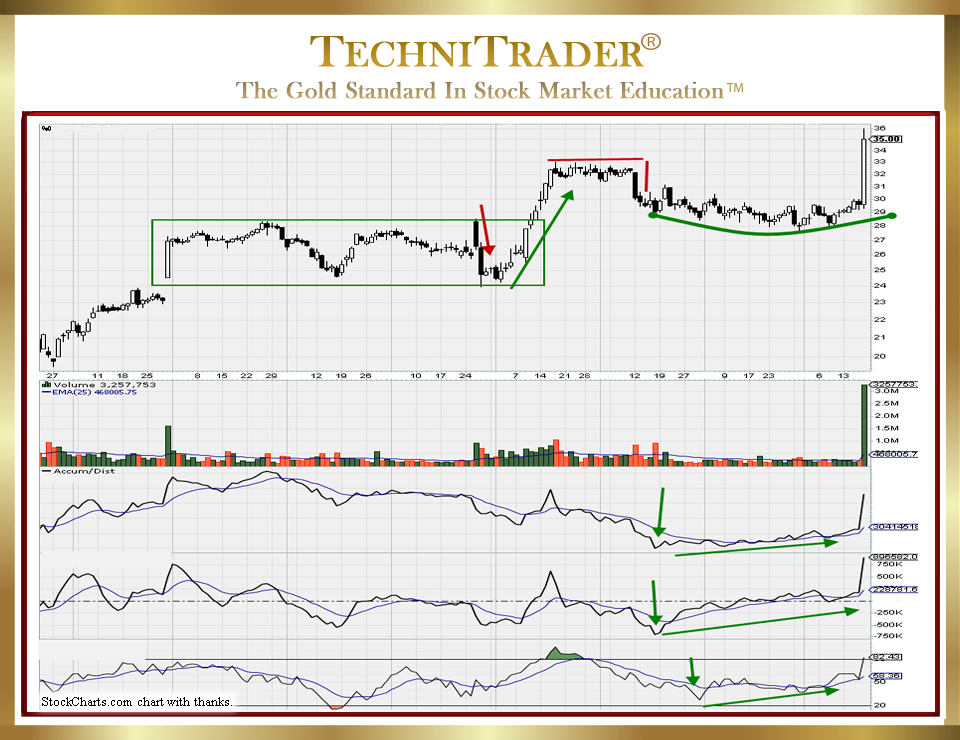
The candlestick chart example below definitely had the Dark Pool footprint. It formed a Flat Top Candlestick Pattern on the daily short-term trend after a momentum run out of a prior High Frequency Trader (HFT) run down. This top slid price down rather than gapping it down. The short-term Rounding Candlestick Pattern bottom formation is indicative of an accumulation mode by Dark Pools trading off the exchanges.
LEARN MORE at TechniTrader.Courses

The Institutional Investors’ tracking indicators show early on a V-Bottom Formation, which is the wake-up call for Technical Traders to start watching this bottom more closely. Professional Traders enter toward the end of the Rounding Bottom Candlestick Pattern, completing the rounding shape quickly. Then, the Institutional Investors’ tracking indicators all confirm that Dark Pool Quiet Accumulation is steady and consistent. High Frequency Traders discover the liquidity draw and run the stock up quickly at market open for a huge one-day gain.
Tracking Dark Pool activity via your charting software is something every Retail Trader and Technical Trader needs to learn. However, it requires a shift of mindset away from the theory that “Price is the most important indicator” to “stock Volume tracks the Dark Pools”.
The Dark Pools have a wide variety of stock order types called Time Weighted Average Price (TWAP) orders. The goal of these complex orders is to not disturb the price trend underway, but also to control the execution price precisely so that their “range of price” sets the ping that triggers the automated Time Weighted Average Price orders for them.
Whenever there is repetitive order activity, your stock charts will reveal this activity even if price stays relatively flat in a consolidation or platform pattern. What is required are stock indicators that can reveal the Time Weighted Average Price orders over time, and that means using stock volume-based indicators.
Momentum trade runs generally occur AFTER the Dark Pools have accumulated all of the stock they want for their inventory at that time, which usually takes a few weeks to several months.
LEARN MORE at TechniTrader.Courses
Professional Traders are able to pick up the liquidity draw by using more exotic algorithms and professional technical indicators. The Professional Trader tends to follow the Dark Pool Quiet Accumulation patterns, and their buying initiates the swing trading momentum runs.
High Frequency Traders later will pick up the Professional Traders’ activity, and then the stock will either run hugely for one day or gap up. Either way, it creates a high-profit trade for Retail Traders and Technical Traders.
Finding Dark Pool footprints is the first step to higher profits for your swing momentum trades.
To confirm what is seen in the chart, Fundamentals can be checked to verify the facts that the chart reveals:
The candlestick chart example just had a huge-lot order from a Buy Side Institution that increased Institutional Investor ownership temporarily over 101%. This will pattern out as the new number of outstanding shares is adjusted to reflect the direct purchase of a BLOCK ORDER of shares directly from the corporation. This stock has 62 million outstanding shares on record at this time.
Currently, 202 Institutional Investors hold this stock as a Charter Stock for their fund development. In the last reported quarter, New Positions were 35, over 12 Sold-Out Positions, and those were Smaller Funds. T. Rowe Price Associates, which is a Giant Fund, holds the largest number of shares, Dimensional Fund Advisors holds the second-largest number of shares, and Vanguard holds the third-largest number of shares. On the Sell Side, BlackRock is the largest holder. Vanguard, Dimensional, and BlackRock all increased their holdings recently.
Summary
You may or may not find the Fundamental Data interesting; however, what it tells you is that the chart is correct and revealed EARLY ON that this stock was under some heavy Dark Pool Quiet Accumulation. This presented the opportunity to set a “Rise into Strength” stock order type to allow an easy entry for a strong profit on a swing trading momentum trade.
LEARN MORE at TechniTrader.Courses
If you have not yet begun to trade or invest, go to Introduction: Learn How to Trade Stocks – Free Video Lesson to get started.
Learn the steps to trade like a pro with this introductory mini course. You will learn what it takes to create a Professional Trading Plan that can help you achieve your trading goals: How to Create a Professional Trading Plan
Trade Wisely,
Martha Stokes CMT
TechniTrader technical analysis using a StockCharts chart, courtesy of StockCharts.com
Chartered Market Technician
Instructor & Developer of TechniTrader Stock & Option Courses
Copyright ©2017–2025 Decisions Unlimited, Inc. dba TechniTrader. All rights reserved.
TechniTrader is also a registered trademark of Decisions Unlimited, Inc.
