Why Does Time Segmented Volume Indicator Lead Price?
Has a Unique Cumulative Formula Rather Than Average-Based
Time Segmented Volume (TSV) is a rare stock Volume Oscillator which provides leading indicator signals that are invaluable to short-term trading of stocks. Applicable styles of trading include Swing Trading, Momentum Trading, Position Trading, and Day Trading. As the Market Structure has changed exponentially in the past decade, Time Segmented Volume has become an even more powerful Worden Bros. TC2000 indicator for leading stock price movement.
When a stock Volume Indicator “leads price”, it is often diverging, or moving in the opposite direction of price. This leading quality of Time Segmented Volume is one of its best features.
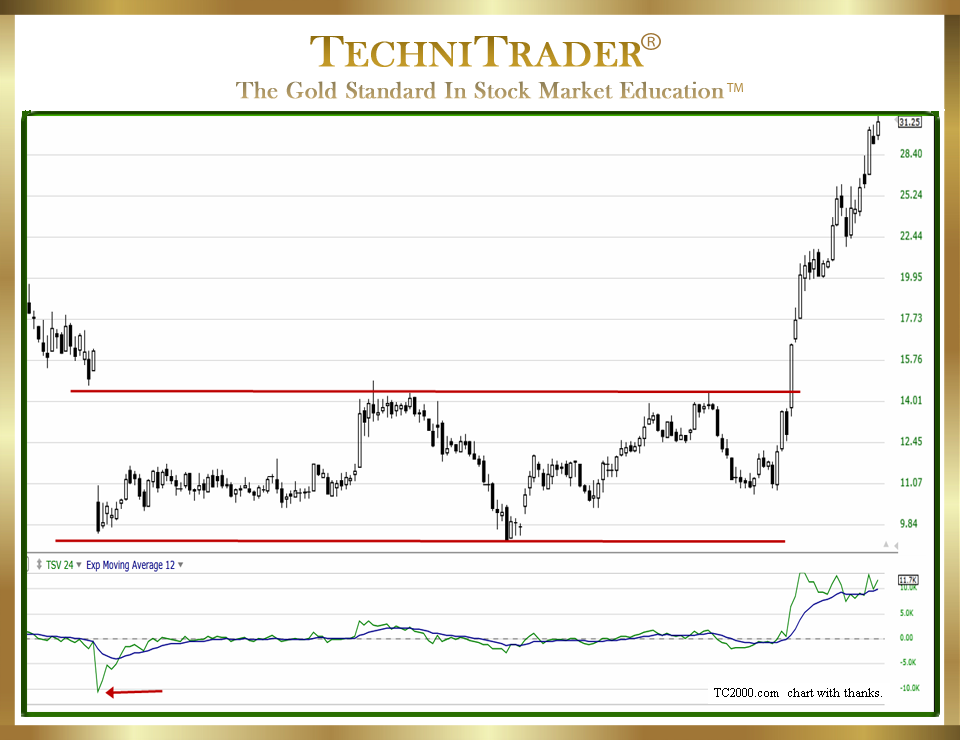
See the chart example below.
LEARN MORE at TechniTrader.Courses

One of the many signals that are vital to Retail Traders is the Spiking V-Bottom Time Segmented Volume Formation. This signals that stock Volume has exhausted to the downside. It also signals that Dark Pool Quiet Accumulation halted the sell-off as the giant Buy Side Institutions using Alternative Trading Systems (ATSs) began their hidden accumulation.
A red arrow points to the V spike to the bottom of the chart indicator window for the Time Segmented Volume indicator. The red lines show the Dark Pool Quiet Accumulation range of price aka Dark Pool Buy Zone™ that the giant Buy Side Institutions were using for buying this stock. They tend to accumulate for several weeks to several months. It is common for Time Segmented Volume to waffle around its center line during lengthy Dark Pool Quiet Accumulation. Professional Traders often begin to pick up the liquidity draw that is hidden in the Dark Pool venues. They tend to move price with strong momentum, which occurred in this stock.
Time Segmented Volume has many signal patterns you can learn. As you become more familiar with its subtler signal nuances, its leading qualities can help you enter the stock sooner in a run and exit almost at the high of the run. The leading signal patterns of Time Segmented Volume are easily seen once you know what to look for and how to understand the dynamics of Time Segmented Volume and the intent of the indicator writer.
LEARN MORE at TechniTrader.Courses
Don Worden wrote Time Segmented Volume, and it remains one of his best efforts in stock indicator writing. He wrote many indicators for the professional side of the market before starting the Worden Bros. Charting Software company years ago, which is now TC2000.
Time Segmented Volume has a totally unique formula that is cumulative rather than average-based. This keeps the line indicator from jumping around when data is dropped from the formula, as is the case in most moving average-based formulas.
It works on Indexes, Stocks, Exchange-Traded Funds (ETFs), and Real Estate Investment Trusts (REITs). Using it for entry and exit confirmation signals is a straightforward approach to using this wonderful stock indicator. However, it can also be used with another primary indicator. For example, adding a Price Oscillator to the analysis of Time Segmented Volume can be helpful for seeing the sustainability of a trend.
It is also improved greatly by adding a subordinate indicator such as a Moving Average, Moving Linear Regression Lines, or Rate of Change.
Summary
Time Segmented Volume has many signals for short-term trading. The Spiking V-Bottom Time Segmented Volume signal warns that Selling Short is not a good idea as the Dark Pools have already entered and are quietly accumulating the stock. Trying to Sell Short against larger lots causes whipsaw action. As the stock price compresses, Professional Trader footprints show on the chart. Then, Retail Traders can confirm price compression with the Time Segmented Volume indicator pattern, and using Swing Trading can enter before the stock runs up with momentum.
LEARN MORE at TechniTrader.Courses
If you have not yet begun to trade or invest, go to Introduction: Learn How to Trade Stocks – Free Video Lesson to get started.
Learn the steps to trade like a pro with this introductory mini course. You will learn what it takes to create a Professional Trading Plan that can help you achieve your trading goals: How to Create a Professional Trading Plan
Trade Wisely,
Martha Stokes CMT
TechniTrader technical analysis using a TC2000 chart, courtesy of Worden Bros.
Chartered Market Technician
Instructor & Developer of TechniTrader Stock & Option Courses
Copyright ©2017–2025 Decisions Unlimited, Inc. dba TechniTrader. All rights reserved.
TechniTrader is also a registered trademark of Decisions Unlimited, Inc.
