
What Is Advanced Technical Analysis of Candlestick Charts?
List of Tips for Choosing High-Quality Stock Picks
Advanced Technical Analysis of Candlestick Charts for Trading Stocks gives you more opportunities to trade high-quality stock picks that earn more profits per trade. The goal with every trade you make should be higher profits per trade. Taking pennies for profit on a trade will result in lower overall income from trading at the end of the year.
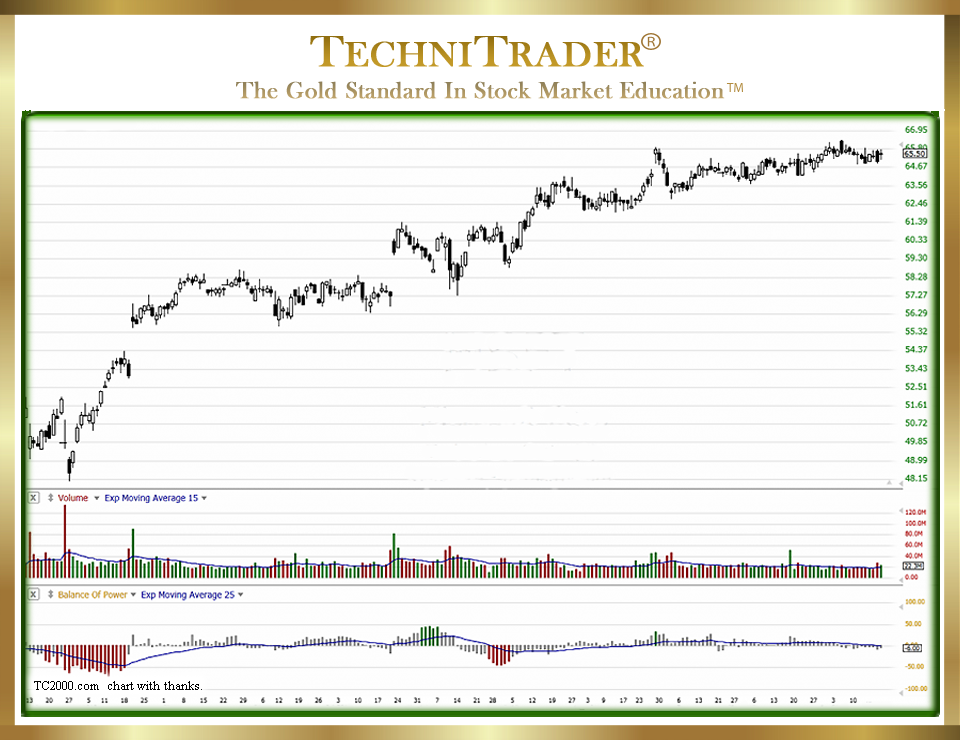
See the candlestick chart example below.
LEARN MORE at TechniTrader.Courses
Remember, your time is a cost factor. Trading frequently with small nickel-and-dime profits increases risk, wastes time, and is extra work. Trading high-profit stocks, trading only when the patterns are ideal, and taking whole points per trade will increase your success and income dramatically.
Often, traders focus on finding a reversal or continuation pattern but fail to see the entire picture of what the candlesticks are telling you.
Candlestick Charts for Trading Stocks provide a visual image that is far easier to read and understand than any other charting type.
LEARN MORE at TechniTrader.Courses
Hone Your Candlestick Chart Analysis with 10 Simple Techniques:
- Compare the Current Run Gain in points to previous runs on the short-term trend.
- Are there Shrinking Runs, where each run up has smaller candlesticks and less point gain?
- Determine if Black or White Candlesticks are dominant.
- Compare Wicks and Tails for length and quantity.
- Look at the Candlestick Sizes over the past month.
- Identify which Trendline Pattern is forming, and is it changing?
- What are the types of Gaps in the chart? These reflect which Stock Market Participant Group is active in momentum.
- Use Relational Technical Analysis™ to compare stock Volume and Price patterns, as well as giant-lot accumulation or distribution patterns.
- Is the Angle of Ascent™ for this stock actually sideways, or is it still trending upward or downward?
- Do you find Repetitive Candlestick Patterns?
Summary
Traders must be aware of other aspects of the chart, such as the relationship between black and white candlesticks, the length and quantity of wicks and tails, the candlestick sizes over time, and the trendline PATTERN as well as the trend. All of these matter when selecting a stock pick for a high-profit return.
LEARN MORE at TechniTrader.Courses
If you have not yet begun to trade or invest, go to Introduction: Learn How to Trade Stocks – Free Video Lesson to get started.
Learn the steps to trade like a pro with this introductory mini course. You will learn what it takes to create a Professional Trading Plan that can help you achieve your trading goals: How to Create a Professional Trading Plan
Trade Wisely,
Martha Stokes CMT
TechniTrader technical analysis using a TC2000 chart, courtesy of Worden Bros.
Chartered Market Technician
Instructor & Developer of TechniTrader Stock & Option Courses
Copyright ©2017–2025 Decisions Unlimited, Inc. dba TechniTrader. All rights reserved.
TechniTrader is also a registered trademark of Decisions Unlimited, Inc.