
What Are New Bottom Formations for Technical Traders?
Basing Bottoms Formed by Dark Pool Buy Zones™
One thing that is a constant in the Financial Markets and especially in the Stock Market over the past few years is change. Everything about Technical Analysis is changing. It is often hard for Retail Traders who trade from home and Technical Traders who are Semi-Professional Traders making a high income from trading stocks to keep up with all the changes.
The candlestick chart example below is a low-priced stock, and it is often within the price range that beginners need to study or lower capital base traders prefer. The all-time high is around $41, so it is a super bargain at $6–$7 for giant Buy Side Institutions using Dark Pools.
LEARN MORE at TechniTrader.Courses
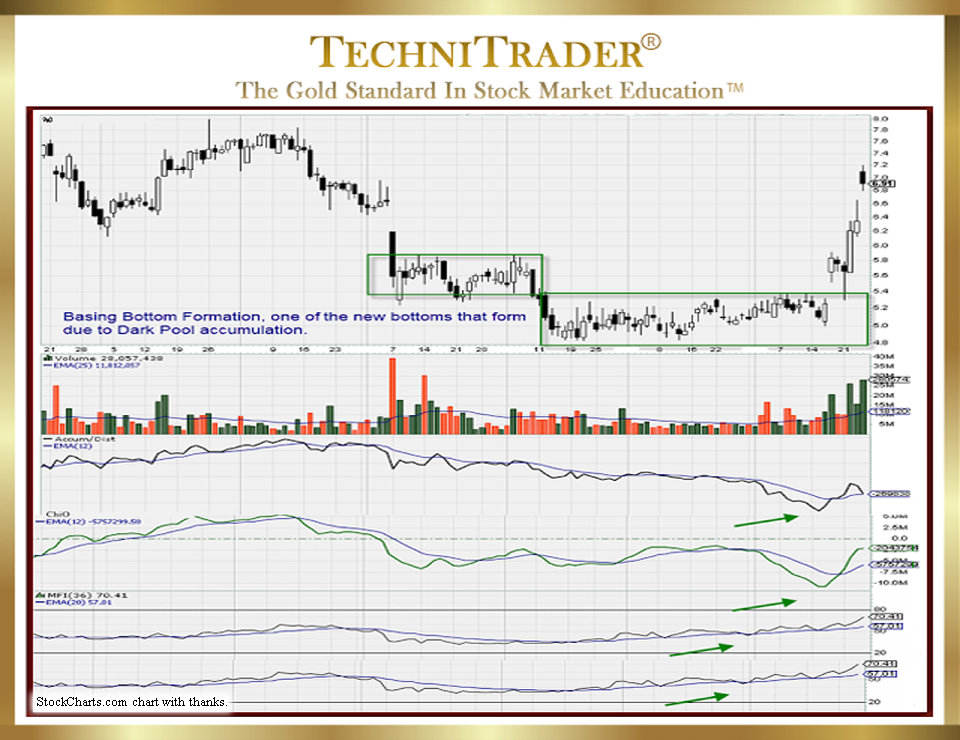
One of the new Bottom Formations for Technical Traders that develops when Dark Pool Quiet Accumulation is underway is what is called a “Basing Bottom”, which TechniTrader Staff identified and have tracked and studied for several years now. It is usually a short-term pattern that concludes with a sudden momentum accelerated price run upward.
Indicators that are stock Volume-based offer earlier convergence and divergence signals and confirm the presence of Dark Pools. The key to recognizing these patterns as a Basing Bottom is to understand the goals and intent of the giant Buy Side Institutions who use Dark Pools and Twilight Pools to hide their huge-lot orders.
This allows traders to enter the stock before price runs or gaps up and runs. Recognizing early signals in candlesticks and indicators is crucial to being able to use the Basing Bottom for Momentum Trading runs.
LEARN MORE at TechniTrader.Courses
The giant Buy Side Institutions’ intent of the purchase:
- To buy a stock at a bargain price before others realize the company is turning itself around, and in future Earnings Reports, the company will have strengthening Fundamentals.
- To NOT disturb the trend or price action. Giant Buy Side Institutions who buy millions of shares of a company over an extended period of time within Dark Pool Buy Zones’ price ranges used to show up on the exchanges. Consequently, the Small Order Execution System (SOES) Bandits of the 1980s as well as the Retail Traders and Professional Traders of the 1990s could see the large-lot activity. Now the giant Buy Side Institutions’ large-lot buying is hidden off the exchanges, BUT it shows up in your charts IF you know what to look for in Candlestick Patterns and stock Volume-based indicator patterns.
- They allow everyone else to move price upward when their Dark Pool Quiet Accumulation has been completed.
New Bottom Formations for Technical Traders (and new Top Formations, too) have been areas of Technical Analysis that have changed dramatically due to the plethora of new stock order types for the professional side of the market. However, not much has changed for Retail Traders using Retail Brokers because Retail Brokerages have commoditized everything.
Unfortunately for many new traders, they do not realize that there is a huge difference between “trading”, aka entering an order in broker software, and Technical Analysis, which provides superb entries and reliable exits.
Most Retail Traders simply use recommended stocks, so their Return on Investment (ROI) yields are very low compared to what a Professional Trader or Semi-Professional Trader earns. There is definitely bias against under-$10 stocks by many Retail Traders, but this is something to set aside.
The Securities and Exchange Commission (SEC) pilot forward test program for “small cap” stocks, of which many trade under $10, had the goal to increase liquidity for the giant Buy Side Institutions using Dark Pools who requested this study. The spreads were widened on the smaller cap stocks in this test, and so there is more energy, more momentum, and thus more opportunities, especially for traders who have limited capital resources.
Summary
All Retail Traders and Technical Traders need to accept the fact that Technical Analysis is evolving. It is important to not be resistant to changes and to be open-minded toward learning the new Candlestick Patterns including new Bottom Formations for Technical Traders.
Technical Analysis is not static; it changes and evolves as the Market Structure changes. We have had more changes in the Market Structure in the past few years than at any other time in the history of the market. Therefore, it is important to recognize that since the Market Structure has changed, technical patterns are also changing.
LEARN MORE at TechniTrader.Courses
If you have not yet begun to trade or invest, go to Introduction: Learn How to Trade Stocks – Free Video Lesson to get started.
Learn the steps to trade like a pro with this introductory mini course. You will learn what it takes to create a Professional Trading Plan that can help you achieve your trading goals: How to Create a Professional Trading Plan
Trade Wisely,
Martha Stokes CMT
TechniTrader technical analysis using a StockCharts chart, courtesy of StockCharts.com
Chartered Market Technician
Instructor & Developer of TechniTrader Stock & Option Courses
Copyright ©2017–2025 Decisions Unlimited, Inc. dba TechniTrader. All rights reserved.
TechniTrader is also a registered trademark of Decisions Unlimited, Inc.