
How to Read a Candlestick Chart for Stock Trading
List of 5 Tips About Price Action Revealed
A skill that all traders need to hone and strive to improve constantly is how to read a candlestick chart for stock trading. Candlestick patterns of price action matter. What price is doing tells a great deal about which Stock Market Participant Groups are controlling price action.
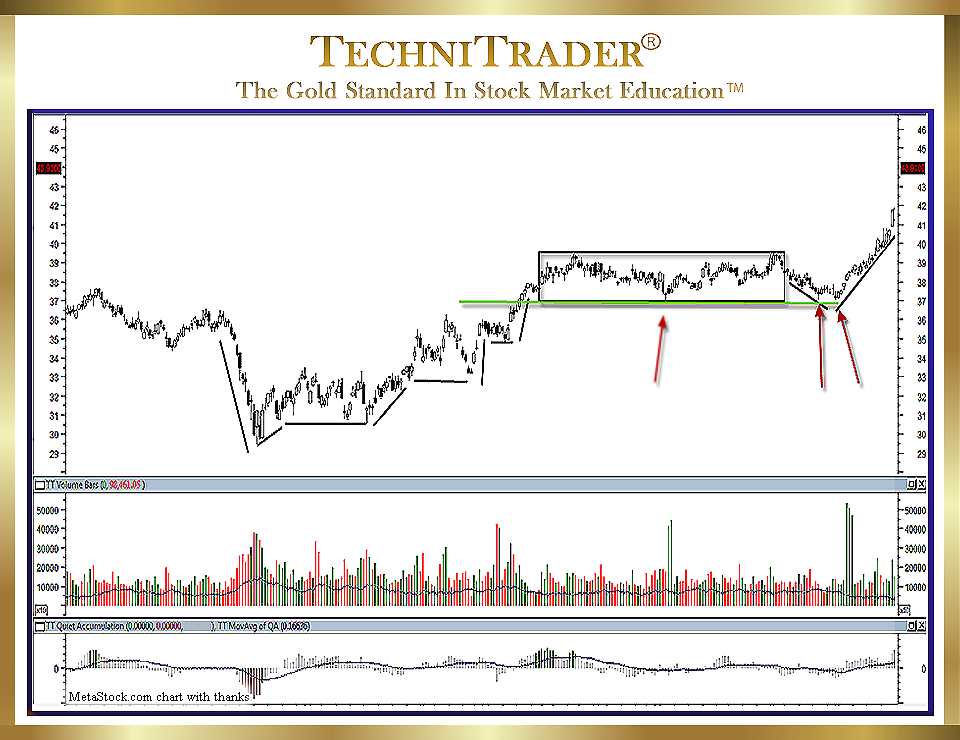
The candlestick chart example below shows price action underlined on the left at an extreme Angle of Descent™ into the lowest low before a bottom commences. Even as this final sell down occurs, it is obvious that the steepness of the Angle of Descent is unsustainable. In addition, the TechniTrader Quiet Accumulation (TTQA) indicator in the bottom chart window with red bars is exposing Smaller Fund capitulation as the stock tumbles.
LEARN MORE at TechniTrader.Courses
Understanding how to read a candlestick chart for stock trading is important in that realizing 5 Tips about stock price action are revealed when you know who is in control of price.
List of 5 Tips About Price Action Revealed is below:
- How price will behave
- How price will react to support and resistance
- How long price will move in that pattern
- What to look for ahead of sudden price moves
- When a top or bottom is underway
In learning how to read a candlestick chart for stock trading, see the sideways candlestick pattern after the low, which is indicative of the Buy Side Institutions buying in incrementally with controlled and bracketed orders in Dark Pools over time. Since some Retail Traders and High Frequency Traders (HFTs) are still trying to Sell Short against the strength of the Buy Side Institutions’ buying, the up-and-down and day-to-day price candlestick pattern forms.
Then, as the stock moves up to the first tier of resistance around $35–$37, the High Frequency Traders realize that Dark Pool buying by the Buy Side Institutions has been going on.
LEARN MORE at TechniTrader.Courses
So, they rush to buy in quickly, creating a buzz in the Retail Trader world, and short-term Swing Trading occurs. At this time, the Buy Side Institutions have accumulated what they wanted, and so the news spreads of their buying.
This creates speculative runs due to emotional At Market buying by Smaller Funds. The stock runs up, and then it hits stronger resistance where it stalls. Momentum evaporates and the stock moves sideways in a Platform Candlestick Pattern, which has a box drawn around it to assist in learning how to read a candlestick chart for stock trading.
It could have just as easily started to move down in a correction. It did not because as profit taking began by the High Frequency Traders’ and other Professionals’ short-term Swing Trading, the Buy Side Institutions buying in Dark Pools entered again controlling price action tightly with their orders off the exchanges.
Platforms are a “value-oriented” Market Condition where the dominant buyers are Buy Side Institutions buying large lots incrementally over time in Dark Pools. This is usually based on Earnings Reports.
The stock slides downward during the latter part of the sideways action. However, the Buy Side Institutions are not selling, but rather they have stopped their accumulation, and a void of buying by these huge-lot purchasers causes a slip slide action.
But if you study the slip down price action closely, you will see that the stock stops just at the lowest low of the Platform; see the first red arrow on the left pointing to that lowest low. In understanding how to read a candlestick chart for stock trading, this indicates that the Buy Side Institutions stopped buying. Then, as the stock slipped to the low range, their buying started again briefly, as indicated between the next two red arrows.
Summary
The shift of trendline patterns throughout this candlestick chart show learning how to read a candlestick chart for stock trading is about recognizing where one Stock Market Participant Group started and stopped buying the stock and a different Stock Market Participant Group took control of price.
By understanding that the upward trend cycle has many different tiers and layers of a variety of Stock Market Participant Groups, you can quickly identify which of them control price at what time. When you learn to recognize who controls price action, you will know how price will behave, and that tells you what to expect next.
LEARN MORE at TechniTrader.Courses
If you have not yet begun to trade or invest, go to Introduction: Learn How to Trade Stocks – Free Video Lesson to get started.
Learn the steps to trade like a pro with this introductory mini course. You will learn what it takes to create a Professional Trading Plan that can help you achieve your trading goals: How to Create a Professional Trading Plan
Trade Wisely,
Martha Stokes CMT
TechniTrader technical analysis using a MetaStock chart, courtesy of Innovative Market Analysis, LLC dba MetaStock
Chartered Market Technician
Instructor & Developer of TechniTrader Stock & Option Courses
Copyright ©2017–2025 Decisions Unlimited, Inc. dba TechniTrader. All rights reserved.
TechniTrader is also a registered trademark of Decisions Unlimited, Inc.