
How to Identify Downside Breakouts Prior to a Top
Recognize Shift of Sentiment™ Patterns in Indicators
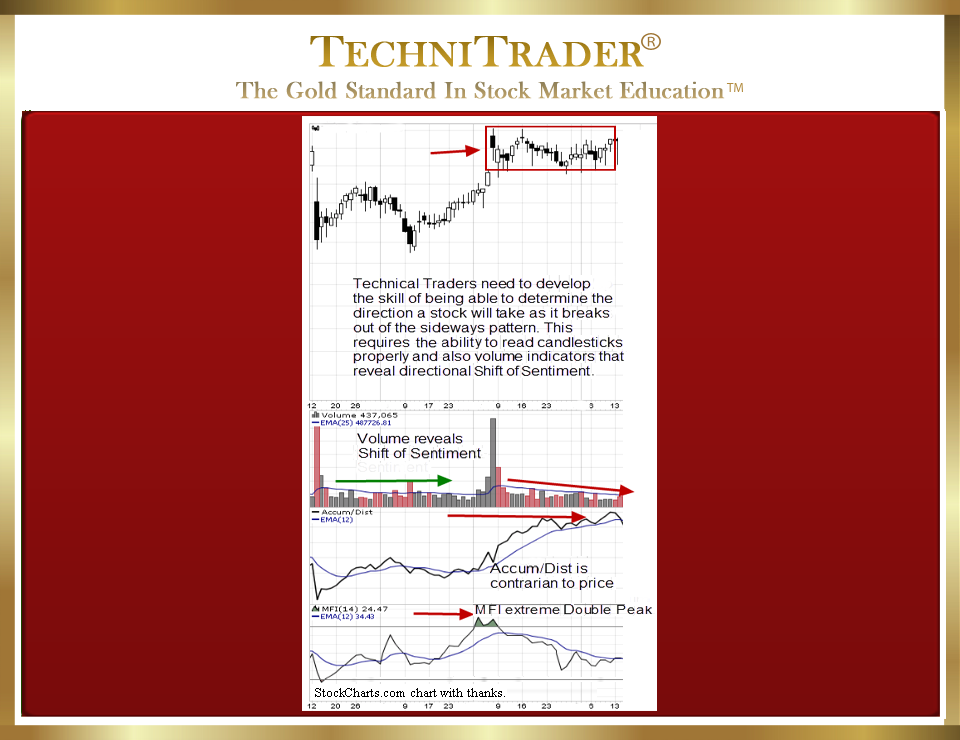
One of the more frustrating patterns for many Technical Traders and Retail Traders are the Flat Top Candlestick Patterns that form today. These new Topping Formations surprise many traders and result in whipsaw trades and losses with breakouts to the downside. What appears to be a solid Consolidation, Platform, or other Sideways Candlestick Pattern that would continue to move price upward suddenly breaks to the downside with no obvious reason.
See chart example #1 below.
LEARN MORE at TechniTrader.Courses
When a Technical Trader is able to read a sideways price action as easily as they read a run up or down, they are able to trade more stocks with higher profitability. In addition, their ability to enter the run sooner increases.
There are several clues at this stage of the stock chart development that indicate which direction price will break. First of all, the indecision candlesticks within the sideways action reveal a weakness for an upside breakout. This stock is barely containing the heavy selling pressure from Dark Pool Quiet Rotation™ by the giant Buy Side Institutions trading off the exchanges in Dark Pools.
This hidden selling pressure is seen in the shorter duration of runs, the weaker run gain potential, and the prevalence of longer wicks on candlesticks. The candlesticks are also not forming a tight sideways Consolidation with a consistent low basing pattern, which is indicative of an upside breakout. This Consolidation low range wavers up and down, a common sign of selling pressure.
The black stock Volume spike by High Frequency Traders (HFTs) is often an exhaustion pattern, and the stock Volume bars that follow are declining steadily, which is easily seen using an Exponential Moving Average (EMA). Compare that to the prior red stock Volume spike, where stock Volume maintained its average and price moved up.
Confirmation of this analysis is with the Accumulation/Distribution indicator showing a selling pressure within quantities to the downside and a steady decline on Flow of Funds out of the stock as it moves sideways.
All candlesticks and indicators confirm that this stock is under heavy Dark Pool Quiet Rotation that is hidden within price which is moving sideways.
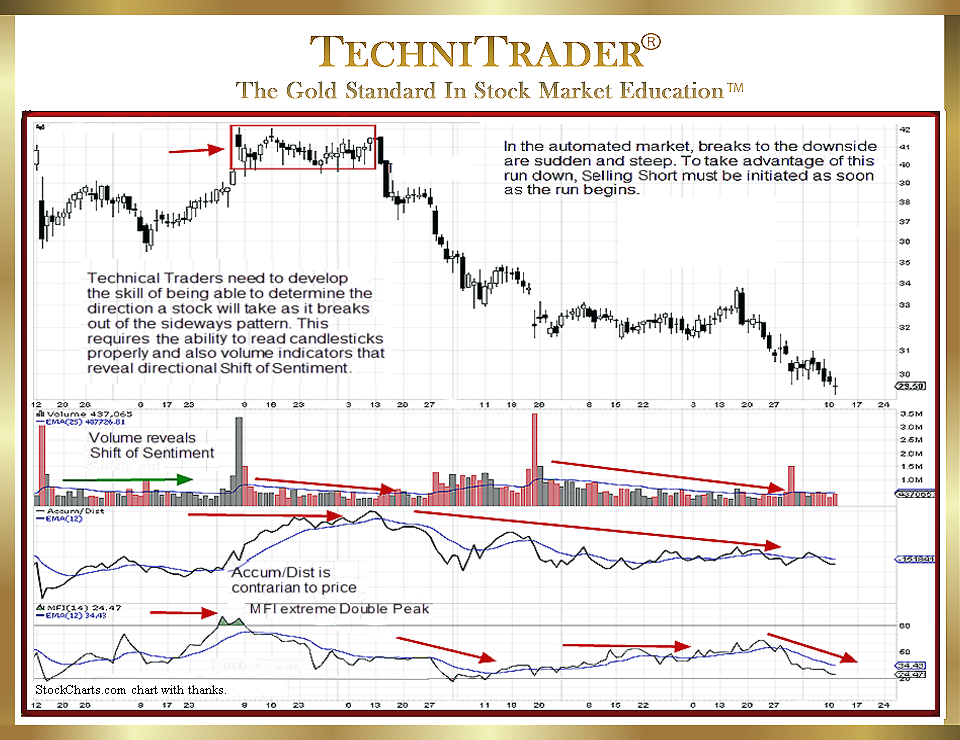
Chart example #2 is the same stock, and it shows what happened in the following months.
LEARN MORE at TechniTrader.Courses
By dissecting the Price, Time, and Quantity Data on a chart, Technical and Retail Traders can learn to identify when a stock in a Consolidation, Platform, or other Sideways Candlestick Pattern is under Dark Pool Quiet Rotation selling pressure that does not show in price or candlesticks as a downward action.
Most Technical Traders and Retail Traders assume that if large quantities of stock are being sold, it will show up in the chart as a downtrend or run down. No longer is this a viable assumption due to new stock order types for the giant Buy Side Institutions who use Dark Pools and new processing systems on several dozen trading venues.
A stock can be under heavy selling pressure without disturbing price or maintaining a Consolidation or Platform until a sudden breakout to the downside occurs, surprising most traders.
Breakouts to the downside in the automated marketplace are faster than they were even a decade ago. This is due to changes in Market Structure, the elimination of the Uptick Rule, increased High Frequency Trader activity, more giant Buy Side Institutions using Dark Pools, and the decision to use Decimals instead of Fractions. Although these changes occurred a decade or more ago, the patterns that are forming on charts are continuing to change. This is due to new trading venues, professional stock order types, professional strategies, indicators, and tools that are developed and used by the giant Buy Side Institutions and the Professional Traders.
Summary
A complete complement of indicators designed to reveal where these Professional Traders are selling before price collapses is necessary. Otherwise, the Retail Trader has no means of being able to prepare for sudden sell-offs called Sheer Cliff Topping Stock Formations™ with collapsing price on what seemed to be a strong Consolidation or a huge gap down that creates a significant loss.
Technical Traders and Retail Traders must learn to trade with the Professional Traders rather than trading against them. Often, traders discover they are in the predicament of being on the opposing side.
LEARN MORE at TechniTrader.Courses
If you have not yet begun to trade or invest, go to Introduction: Learn How to Trade Stocks – Free Video Lesson to get started.
Learn the steps to trade like a pro with this introductory mini course. You will learn what it takes to create a Professional Trading Plan that can help you achieve your trading goals: How to Create a Professional Trading Plan
Trade Wisely,
Martha Stokes CMT
TechniTrader technical analysis using StockCharts charts, courtesy of StockCharts.com
Chartered Market Technician
Instructor & Developer of TechniTrader Stock & Option Courses
Copyright ©2015–2025 Decisions Unlimited, Inc. dba TechniTrader. All rights reserved.
TechniTrader is also a registered trademark of Decisions Unlimited, Inc.