
How to Go Beyond Basic Candlestick Pattern Analysis
Recognizing Who Is Controlling the Stock Price
There is a plethora of analysis training on Candlestick Patterns and interpretation, and yet this remains one of the most problematic areas for Technical Traders who want to trade at the expert level earning high income from just trading stocks.
The candlestick chart example below shows an excellent example of Candlestick Patterns for Swing Trading.
LEARN MORE at TechniTrader.Courses
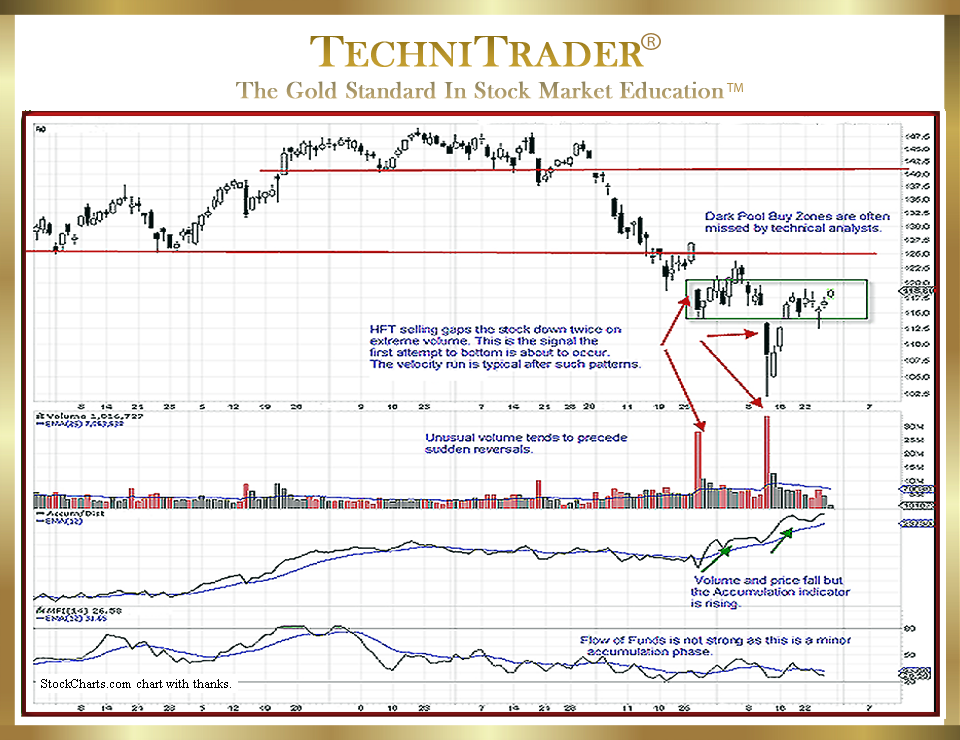
The stock has stalled right at the first tier of bottom resistance, which tends to be weaker when quantities of larger lots start to accumulate.
See where High Frequency Traders (HFTs) took control of price and gapped the stock down for one day. Selling did not continue the following two days, and stock Volume was above the Exponential Moving Average (EMA) but much lower than the High Frequency Traders’ spiking stock Volume pattern.
This was the first accumulation level for this stock. Dark Pools started buying the stock even though High Frequency Traders who typically miss this initial buy mode of the giant Buy Side Institutions drove price down in a second gap down.
This was the next most important candlestick. This gap down opened the trading day, running down 5 points further over the next few minutes.
So, within 10 minutes of open, this stock moved several points. However, the long tail reversal was a key signal to those Swing Trading that this extreme pattern had entered a Dark Pool Buy Zone™ of the giant Buy Side Institutions.
LEARN MORE at TechniTrader.Courses
High Frequency Traders usually trade during the first 30 minutes of the day. Dark Pool orders are often delayed until after Market Close or near the End of Day, which is also evident on an Intraday Chart.
Dark Pools bought into the selling spree instigated by High Frequency Traders in the candlestick chart example above. Since no Smaller Funds dumped and few stock Volume Weighted Average Price (VWAP) orders triggered, the run up was a Velocity Run that ended at the lows of the prior Dark Pool Buy Zone. Now, the institutions are waiting patiently, allowing the news of their buying to leak out naturally, which then creates more interest in the stock.
High Frequency Traders typically create the final gap down low which, if it reverses quickly, indicates a Buy Zone area for the Dark Pools. The next phase will be when Professional Traders and High Frequency Traders discover the Dark Pool Quiet Accumulation. The bottom is not complete, but it shifts sideways if more Dark Pools decide to buy. Sudden Shifts of Sentiment™ are common with these patterns.
Once the basics of Japanese Candlestick Patterns are understood, it is time to move up to the next tier of analysis. That is being able to recognize not only where a pattern is, but also who forms that pattern, why they are capable of creating that pattern, what automated orders generate that pattern, and which Stock Market Participant Groups react or chase that pattern.
Nowadays, it has become critical to include stock Volume with Candlestick Analysis because this provides the basis for recognizing which Stock Market Participant Group created that candlestick pattern.
The analysis of Candlestick Patterns at the expert level involves more than just 1–3 candlesticks; instead, it includes a larger group of candlesticks in the near term. This is especially useful for Swing Trading, Momentum Trading, Velocity Trading, Swing Options Trading, and Day Trading when using Swing-Style Intraday action.
Summary
Learning to read more of the chart pattern and understanding why price is behaving in a certain manner will help you interpret price action better. This will also help prepare you for sudden breakouts of High Frequency Traders’ Momentum and Velocity Runs for both daily Swing Trading and Intraday Swing-Style Trading.
LEARN MORE at TechniTrader.Courses
If you have not yet begun to trade or invest, go to Introduction: Learn How to Trade Stocks – Free Video Lesson to get started.
Learn the steps to trade like a pro with this introductory mini course. You will learn what it takes to create a Professional Trading Plan that can help you achieve your trading goals: How to Create a Professional Trading Plan
Trade Wisely,
Martha Stokes CMT
TechniTrader technical analysis using a StockCharts chart, courtesy of StockCharts.com
Chartered Market Technician
Instructor & Developer of TechniTrader Stock & Option Courses
Copyright ©2017–2025 Decisions Unlimited, Inc. dba TechniTrader. All rights reserved.
TechniTrader is also a registered trademark of Decisions Unlimited, Inc.